How to Use Spatial Data 101
Today, we are going to uncover ways on how to use spatial data. Once again, spatial data – or geospatial data – is data that represents a specific location on the Earth’s surface. It is also data with a location attribute attached. There are many ways to use spatial data. Here are a few example applications of how to use spatial data!
Ways to Use Spatial Data
Using Spatial Data in GIS
The most common way that spatial data is processed and analyzed is using a GIS (geographic information system). This is one way to use spatial data! These are programs or a combination of programs that work together to help users make sense of their spatial data. A user will typically use multiple spatial datasets at one time and compare them or combine them with one another. Each spatial dataset may be referred to as a layer.
The field and study of GIS extends much further than digital mapping and cartography. It consists of a variety of categories including spatial analysis, remote sensing, and geovisualization.
Using Spatial Data for Graphics
Maps are a common practice of presenting spatial data because they can communicate complex topics. They can help validate or provide evidence for decision making, teach others about historical events in an area, or help provide an understanding of natural or human-made phenomena.
When creating visuals, graphics, or maps with spatial data, there are a variety of geographic elements to consider including projection. The projection of a map describes the way that the Earth’s surface, a 3-D shape, is presented on a 2-D surface.
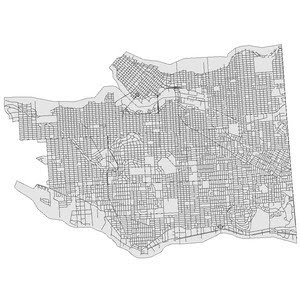
The City of Vancouver is projected using CANBC-Poly resulting in a slightly rotated version of image
Maps can also be used to present what are typically non-visual elements of society. For example, the occurrence of certain events, income level, any demographic descriptor, or relationships like the number of heat strokes in an area compared to temperature. A simple display method is a classification map, also known as a choropleth map. This is another way to use spatial data and present them in different forms of graphics!
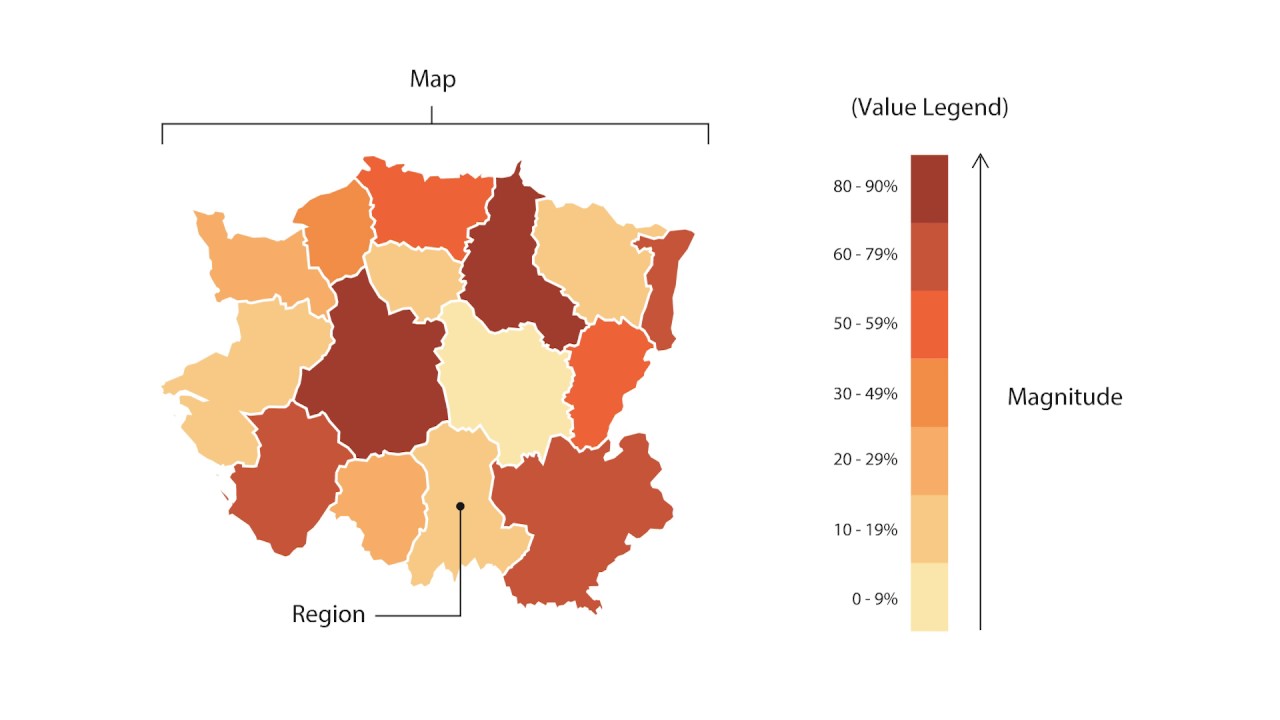
This exhibits divided geographical areas or regions that are coloured in relation to a data variable. You can visualize values over a geographical area, which can show variation or patterns when you look at a chloropleth map.
Using Spatial Data for Statistics
As it is with any data, to truly use, make sense of spatial data and understand what it is saying, you must perform some level of statistical analysis. These processes will lead you to make better decisions for your organization. The major difference between spatial data and all other types of data when it comes to statistical analysis is the need to account for factors like elevation, distance, and area in your analytical process.
Indeed, many spatial statistical processes are quite similar to basic statistical methods. For example, interpolation can help you estimate or predict the value of a sample, and spatial interpolation can help you estimate or predict the value of a variable in a sample location. Similarly, spatial autocorrelation measures the degree of similarity between sample locations just like typical autocorrelation is done.
Using Spatial Data in Snowflake
Innovative, modern technology is what Snowflake is all about. Snowflake, a cloud and data warehouse, is one of the most flexible and fastest ways to manage your data in the cloud. Snowflake has taken cloud computing to the next level by incorporating geospatial support. This allows users to store and use geospatial data directly within Snowflake’s cloud data platform.
Why did they do this? More and more Snowflake users are recognizing the power of geospatial data and are working to integrate geospatial datasets with regular business datasets to make informed decisions. Between FME and Snowflake, data integration challenges are closer to being solved — straightforward integration.
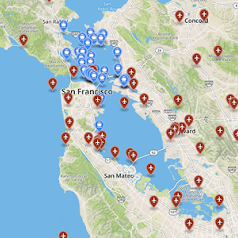
The above image shows where cruise ships and airplanes are travelling in real time on a map.
Snowflake users can connect and use their spatial data to the cloud using the GEOGRAPHY data type. The supported spatial formats in Snowflake include:
- Well-Known Text(“WKT”)
- Well-Known Binary(“WKB”)
- IETF GeoJSON
Once your data is in Snowflake, you can perform over thirty geospatial functions on your data.
FME + Snowflake: As a Snowflake technology partner that provides flexible data integration and ETL options, FME is a part of the larger Snowflake ecosystem. With FME, you can integrate spatial data from various sources without having to code.
That’s right. No coding. Create custom workflows in an intuitive GUI that reads data from over 500 spatial data sources, transform them, and then convert them into a Snowflake compatible format. With support for thousands of coordinate systems, it’s easier for you to make the most accurate transformations you need.
Using and Visualizing Spatial Data in a Web Browser
Another way to use spatial data is to create a web map or 3D scene using a web visualization library. You can share your geospatial data with anyone using a URL. Whether you want to share an interactive web map of your data repository, or something else geospatially awesome, the possibilities are endless and you can build something mind-blowing! Follow this detailed step-by-step guide to creating a visualization. See live demos in our on-demand webinar too!
Give it a Go!
Spatial support for Snowflake is available in FME 2020.1 and up. Try FME for free or download the latest version of FME to try FME yourself.
To learn more about Snowflake and FME, check out Connecting Data (Even Geospatial!) To Snowflake.
This blog post covered Before you go, what are other ways that you use spatial data? How? Let us know in the comments!
Other Related Resources
- Why Spatial Data
- What is the Difference between Spatial and Non-Spatial Data?
- What is Geospatial Data
- 10 Common FME GIS Tasks
- What is the Difference: Geodatabase vs Geospatial Database
- Visualize Geospatial Data in a Web Browser

Nicole Lee