FortisBC uses FME to automate the ongoing integration of BC Wildfire Service wildfire data into their Smallworld GIS environment, enabling their Operations Managers to accurately assess the current wildfire threats to its buildings, transmission and distribution assets, and customers.
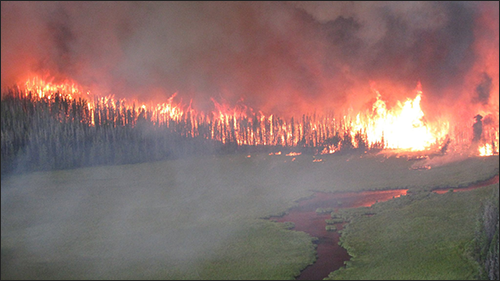
This wildfire photo was one of many posted on the BC Wildfire Service Facebook Page this summer, as they kept the public informed through the worst fire season in the province’s history.
As summer came to a close here in British Columbia, Canada, you could hear a collective sigh of relief across the province.
With more than 100 wildfires still burning, 2017 is officially the worst fire season on record. Nearly 12,000 km2 of land burned this year, 3,000 km2 more than in 1958, the previous record holder.
Approximately 65,000 people were evacuated from their homes, and firefighting efforts have cost the province $510 million.
Thankfully for FortisBC, the largest natural gas utility and second largest electrical utility in the province, their GIS team had the serendipitous foresight to automate their wildfire threat assessment process early this year. So when the wildfires raged, they were ready.
Examining the Manual Process
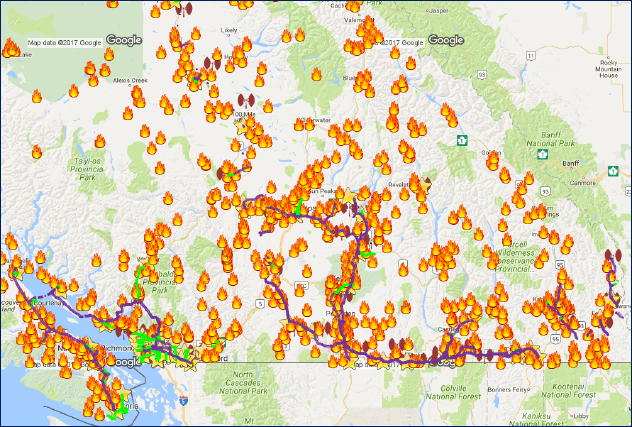
The original manual process had been cumbersome, requiring their Emergency Operations staff to review the active and new wildfires each day using the BC Wildfire Service web map, and then open the FortisBC GIS and manually identify each active location, comparing the two maps to check for wildfire threats to the assets.
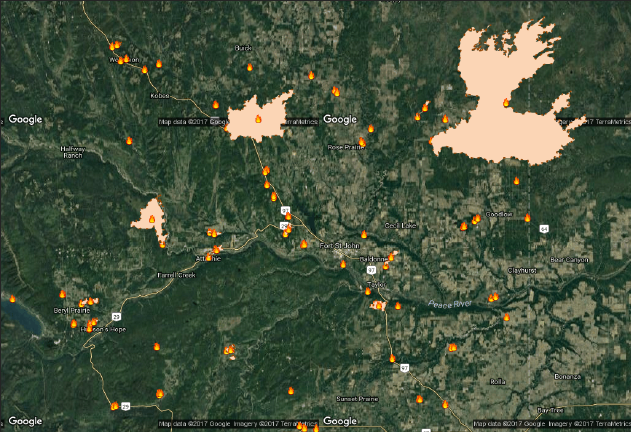
The BC Wildfire Service web map enables businesses and the public to freely access the current status of wildfires across the province.
“In an emergency, we don’t want our Operations Managers to have to spend time making reports,” explains Piet Nooij, GIS Technology Manager at FortisBC.
Exploring Integration & Automation
Their objective was to automate the process by integrating the wildfire map data into their GIS to perform analysis and create reports and plots for first responders.
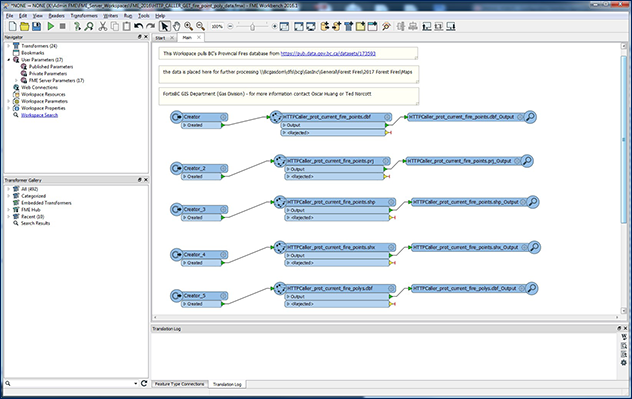
This FME workspace uses parameters entered into the Creator and HTTPCaller transformers to gather data from the provincial government BC Wildfire Service web map obtained via DataBC and integrate it into their Smallworld GIS.
They accomplished this by creating an FME workspace that downloads and integrates wildfire map data (obtained from the provincial government BC Wildfire Branch via DataBC) into their GE Smallworld environment. They published the workspace to FME Server to automatically run every two hours during the peak of the fire season, matching the frequency with which the wildfire map is updated.
 |
“Using FME Server, the system runs nicely. We don’t need to babysit it.” — Piet Nooij, FortisBC |
They then set up a Smallworld Geospatial Analysis Tool project to pull together their landbase, assets, pipelines, transmission lines, power poles, stations, communications towers, and ICI (Integrated Cadastral Information Society) data.
Appreciating Fortuitous Timing
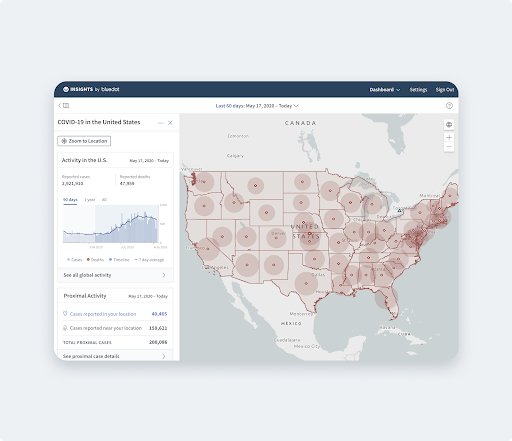
The timing couldn’t have been better. As the wildfires raged this year, the Operations Managers and Emergency responders at FortisBC could access the wildfire threat assessments via VPN as drawings, reports, plots, Excel files, and KMZ files, such as the one shown below.
The FortisBC wildfire system, powered by FME and Smallworld GSA, enables Operations Managers to view the current wildfire situation overlaid with critical FortisBC asset information in KMZ (shown), providing an immediate assessment of the wildfire threat to their assets.
They now have an up-to-date view into the current state of the wildfire situation as it impacts the FortisBC assets.
“Beyond this basic information, our GIS team can also build custom reports using the integrated dataset that this system provides as a starting point,” Piet adds.
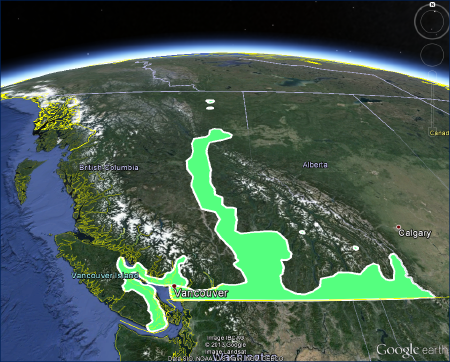
FortisBC provides gas and electrical utilities in the province of British Columbia, Canada with a service area (shown in green) of 240,000 km2
“I can look at all the assets within a 10km buffer of the wildfire, and do an analysis of every asset that interacts with that buffer. Then assess the number of customers that could be impacted.”
“The system provides insight into threats to critical infrastructure, schools, hospitals, care homes, churches, etc. It’s important in an emergency where these are located, because people congregate there.
“These structures also have larger meter sets which require a service technician with a different skill set. Having this information easily available means we send the right people to the places to restore power and gas, keeping people warm and able to cook.”
By also including ICI data, which identifies other local utility companies’ assets, in the system, FortisBC can identify which external assets, such as power poles that share electrical and communications lines, may also be impacted by a wildfire, and initiate communications with those utilities.
The archive of the new system’s data provides detailed records both for the legally required submissions to the BC Utilities Commission, and for their voluntary efforts where FortisBC is providing relief to communities who were evacuated due to wildfires this summer.
The system also ensures that FortisBC always has the latest possible information, even if third-party websites ever were to go down.
Planning for the Future
Piet would like to expand the system in the future to increase their centralized knowledge of the wildfire situation.
BC web cameras could be overlaid as a layer, real-time weather data with wind speed and direction as another layer, and field staff photos could be automatically integrated into the GIS for location-based retrieval.
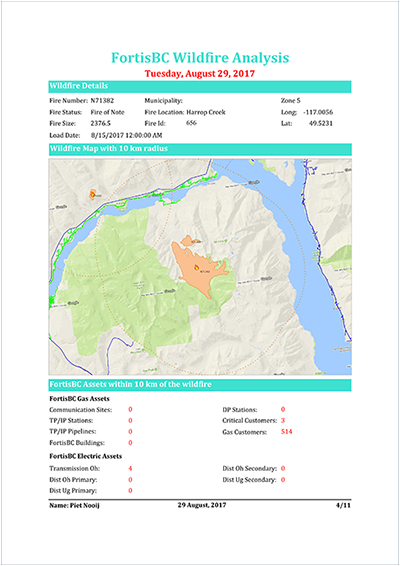
FortisBC provides Operations Managers with email reports that provide a summary of the latest wildfire threat assessments for its buildings, and its transmission and distribution assets, as well as the number of customers affected.
“Maybe a substation has incurred fire damage. Field staff could take a photo with their cell phone and send it to an email address, which FME Server could monitor to collect these photos and load them directly into the GIS. This would be a really nice system to have, especially during emergencies, when assessing and repairing of the damage is critical.”
Another enhancement could be to the mechanism for delivering data updates. Today, Piet’s GIS team sends manual emails to the Operation Managers with links to the data that is always available on the server. The frequency matches the fire season’s intensity. With the fire season coming to a close, the team reduced emails from every two days to twice a week, then weekly, and will soon cease for the winter. Now that they’ve learned that this can be automated with FME Server, they are looking into implementing it to reduce their efforts even further.
Piet would also like to integrate staff locations into the GIS, flagging their proximity to wildfires, so that the GIS team can proactively warn them of changing fire conditions nearby, to complement communications from local authorities.
“We can continue to use FME to make the tool better, so that non-GIS users can get all of the information they need,” says Piet.
“We love FME. We’ve been using it for about 20 years at FortisBC. We use FME Server for many other projects, including data download and upload systems for city planners. Like the wildfire threat assessment project, these systems remove repetitive processes and save my team a lot of time.”
|
“We love FME. We’ve been using it for about 20 years at FortisBC.” — Piet Nooij, FortisBC |

Erin Lemky
Erin leads the Product Marketing team at Safe Software and enjoys connecting people with the information they need. As a Ravenclaw, she is always seeking knowledge that can help customers improve the world with their innovation. After work, she can be found tending to her permaculture homestead or reading a fantastic adventure with her family.