Shortly after the launch of Amazon Redshift in 2013, Safe Software added support for the data warehouse in FME, allowing users to load data into Amazon Redshift and query data at a massive scale. Amazon Redshift is a fully managed data warehouse with automatic scaling and geo-replication capabilities ideal for storing and analyzing petabytes of data with standard SQL.
In late 2019, Amazon Redshift announced native geospatial data processing capabilities and the addition of the geometry data type. We’re excited to share that FME 2020.1 includes support for this capability.
Using Spatial Data with Amazon Redshift and FME
With the new Amazon Redshift Spatial Reader, you can query your spatial datasets to extract only the information you need and refine your data with one of the 493 transformers in FME. Integrate the results with other systems and databases to unlock more business insight.
The new Amazon Redshift Spatial Writer allows you to load spatial data from 450+ supported sources into Amazon Redshift without writing a single line of code. This makes it incredibly easy to integrate and harmonize your spatial data.
FME has an intuitive user interface that guides you through the process of creating consistent and repeatable data workflows. With more and more spatial data becoming available from disparate sources, quality control and reliable data integration is a key requirement before data can be stored and queried for insights in a data warehouse like Amazon Redshift. Geometry validation, coordinate system reprojections, and generalizations are just a few of the core features FME provides.
FME also provides advanced automation capabilities like scheduling and event-based triggers. Once you’ve created and tested your data integration workflow, take advantage of these features and automatically deliver notifications and reports to keep stakeholders up-to-date.
How to Integrate Spatial Data with Amazon Redshift
Let’s take a look at a simple example of loading spatial data into Amazon Redshift. We’ll be working with a CSV file that contains the locations of all trees throughout the City of Vancouver and an Esri shapefile with local area boundaries. We want to store this data in Amazon Redshift and then run a spatial query on both datasets to determine the number of trees per local area.
If you don’t have FME Desktop and would like to give this demo a try or connect other data sources, you can download a free 30-day trial!
For step-by-step instructions, check out our how-to video using the same datasets from the City of Vancouver’s Open Data Portal and download a template of this workspace from FME Hub.
Part 1: Connect and Transform
To begin, simply drag and drop the CSV and shapefile datasets you’ve downloaded onto the canvas of FME Workbench. FME will automatically detect the data type.
Now, let’s look at the CSV file. If you open it, you’ll notice that the column that contains each tree location is represented in GeoJSON. To successfully load our CSV file into Amazon Redshift, we use the GeometryReplacer to transform the GeoJSON into FME Geometry which will automatically be written to the geometry type column in the Amazon Redshift table with the Amazon Redshift Spatial Writer.
Next add a Reprojector and set the coordinate system to WGS 84 (EPSG:4326). This will make it possible to visualize the tree locations properly on a map.
Next, let’s look at the shapefile. Since FME automatically detects shapefile geometry features and Amazon Redshift can read them directly, no transformation or extraction is needed here. How nice is that?
Part 2: Write to Amazon Redshift
Adding a new writer is easy. Begin typing “Amazon Redshift” anywhere on the canvas and seelect “Amazon Redshift (Spatial)” under “Writers”. Once you’ve selected this writer, you’ll use your Amazon Redshift database credentials to add a Database Connection. Leave Table Definition set to “Automatic”, and FME will create the schema for the new tables based on the data it reads.
You’ll need to add another writer feature type for your shapefile. To do this, click on “Writers” in the toolbar and select “Add Feature Type”.
Now, your writer is ready to go! Run the workspace by clicking the green play button in the toolbar. Once the translation is successful we can query the datasets in Amazon Redshift.
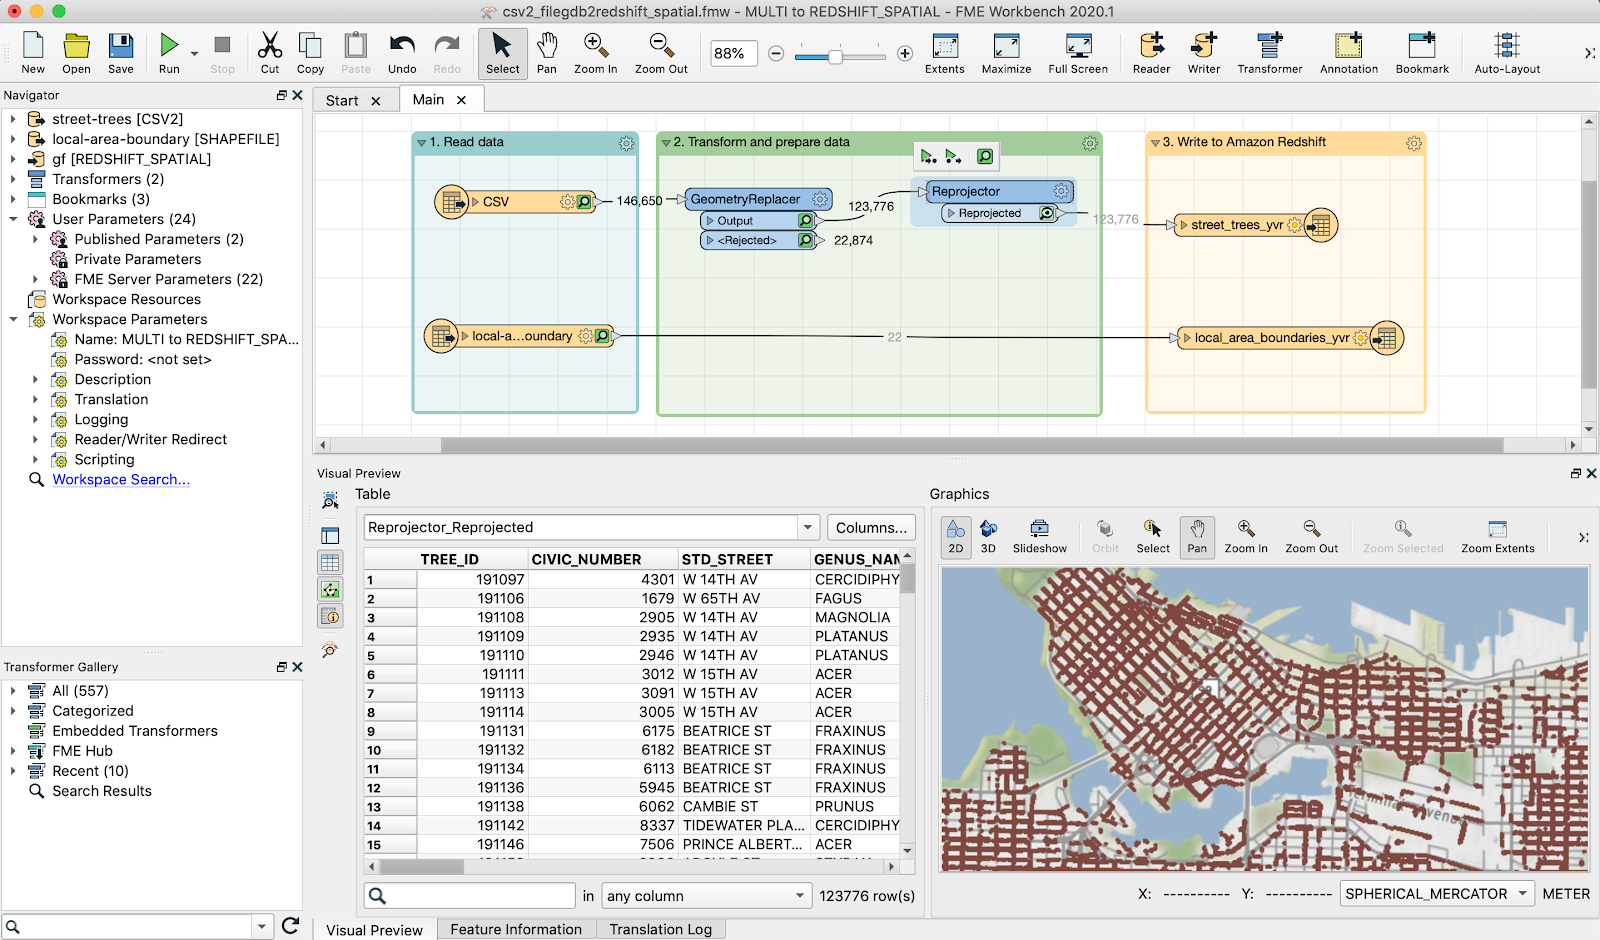
Fig1: The Canvas displays readers, transformers, and writers, while the Visual Preview below displays the inspected data that was transformed in a table and on a map.
Part 3: Query your data in Amazon Redshift
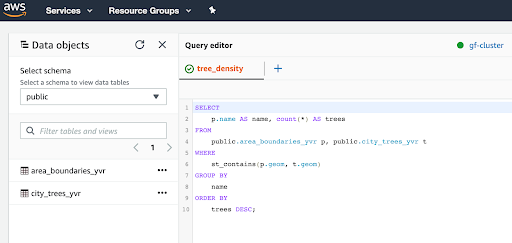
Fig2: This is what your spatial query will look like in Amazon Redshift.
When you refresh your data objects in Amazon Redshift’s Query Editor, you’ll see that both datasets have been loaded. Your spatial query now contains the name of the local area boundary and count of trees in the city and the geometry of the boundaries contain the geometry of the trees.
You can also copy this query into the Query Editor to give this a try yourself:
select p.cfsauid AS id, count(*) AS trees FROM public.postcode_boundaries_yvr p, public.street_trees_yvr t WHERE

st_contains(p.geom, t.geom) GROUP BY id ORDER BY trees DESC;
If you’d like to see an additional example of how to read and write data from Amazon Redshift Spatial, visit our Community: Reading and Writing Amazon Redshift Spatial Databases.

Gerhard Fischl
Gerhard is a FME Cloud Technology Expert at Safe Software. He is one of the top soccer players during lunch time soccer and is an avid bicyclist.