 On any given weekend, tens of thousands of passionate football fans hit the road to follow their team. While I can’t tell you exactly how many supporters travel to every one of their team’s away games, I can tell you very accurately how far they have to go.
In fact, using FME, I can tell you a lot about the geography of football stadiums!
![]()
Background
You may recall an article I wrote last year where I used the example of journey distances for English football team fans to illustrate a data processing technique. Specifically I calculated which team’s fans have the furthest journey to follow their team to all away games.
Well a new football season is about to start and, because of the promotion/relegation system, the Premier League has three new teams replacing three outgoing ones; the perfect time to re-run the analysis, update the numbers, and add a little bit of bonus geography.
![]()
Team Changes
 Previous teams QPR, Hull City, and Burnley were all relegated from the league to be replaced with the newly promoted teams AFC Bournemouth, Watford, and Norwich City.
It’s obvious this is a southern shift (the geographic mean location of stadiums is 37km further south), meaning northern teams are likely to have further journeys than before.
But there’s a shift to the east too (albeit only 9km), with Norwich becoming the most easterly club and only the second team playing in the eastern hemisphere (i.e. with a home stadium east of zero longitude) – West Ham are the other.
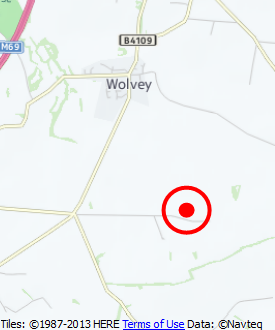
Incidentally, a little FME’ing tells me Coal Pit Lane, Wolvey is the geographic centre of premier league football stadiums (feel free to use that in a sports trivia quiz)!
![]()
Results
So, without further ado, here’s the league table of travel distances. You could call it a ‘convenience league’ since it gets more and more inconvenient for fans, the further down the table their team is!
The +/- numbers are all in comparison to the table for 2014/2015. Obviously cup games are not included.
| # | +/- | Team | Stadium | Travel (KM) | Travel +/- |
| 1 | +0 | Aston Villa | Villa Park | 6,469 | +188 |
| 2 | +0 | Leicester City | King Power Stadium | 6,471 | +159 |
| 3 | +0 | West Bromwich Albion | The Hawthorns | 6,513 | +185 |
| 4 | +0 | Stoke City | Britannia Stadium | 6,999 | +500 |
| 5 | – | Watford | Vicarage Road | 7,063 | – |
| 6 | +1 | Arsenal | Emirates Stadium | 7,323 | -478 |
| 7 | +4 | Tottenham Hotspur | White Hart Lane | 7,415 | -487 |
| 8 | +4 | Chelsea | Stamford Bridge | 7,424 | -495 |
| 9 | +5 | West Ham United | Boleyn Ground | 7,607 | -502 |
| 10 | +5 | Crystal Palace | Selhurst Park | 7,759 | -519 |
| 11 | -6 | Manchester City | City of Manchester Stadium | 7,960 | +862 |
| 12 | -6 | Manchester United | Old Trafford | 7,964 | +853 |
| 13 | -4 | Liverpool | Anfield | 8,650 | +820 |
| 14 | -4 | Everton | Goodison Park | 8,669 | +829 |
| 15 | +2 | Southampton | St Mary’s Stadium | 9,186 | -759 |
| 16 | – | Bournemouth | Goldsands Stadium | 10,113 | – |
| 16 | – | Norwich City | Carrow Road | 10,314 | – |
| 17 | +0 | Swansea City | Liberty Stadium | 11,245 | -105 |
| 19 | +0 | Sunderland | Stadium of Light | 13,038 | +1,111 |
| 20 | +0 | Newcastle United | St. James’ Park | 13,248 | +1,107 |
As before Aston Villa fans have the shortest cumulative journey to away games – albeit with a slight increase – while Newcastle United fans still have the longest.
Obvious winners of the 2015 changes are the London teams: Arsenal, Spurs, Chelsea, West Ham, and Crystal Palace all move up the convenience league with a shortened set of journeys compared to last year.
North-western teams (Liverpool, Everton, Manchester United, and Manchester City) all drop down the table with longer journeys.
But it’s the north-east outliers that suffer the most. Sunderland and Newcastle, already occupying the bottom two places last year, both suffer an extra 1,000+km of travel to away games. Ouch!
The only consolation for Newcastle fans is that petrol (gas) prices have dropped a little from last year. I’d calculated it to be a total travel cost of £1,578 for the 2014 season (£1.30/litre, 10l/100km) but the average fuel price today is £1.16 meaning that even though the distance is more, the costs are ‘only’ £1,536.
Mind you, that’s still £81 per match on average. Double ouch!
![]()
Method
As a quick reminder of the method, for each club I created a list of all other clubs they would need to travel to play, and geocoded the stadium locations in a CSV file. I used FME to turn these into a map of straight line journeys.
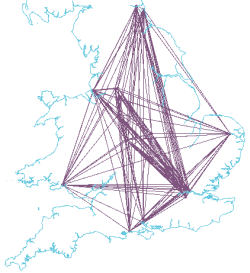
Then I used the FME ShortestPathFinder transformer on an Ordnance Survey dataset of the UK road network to calculate the shortest road route. I didn’t assign a different travel cost to different road types, so there’s no preference for motorways over residential roads, because I was looking for shortest route (not quickest).
Here’s a map of the road routes, with the Norwich City away journeys highlighted in blue:
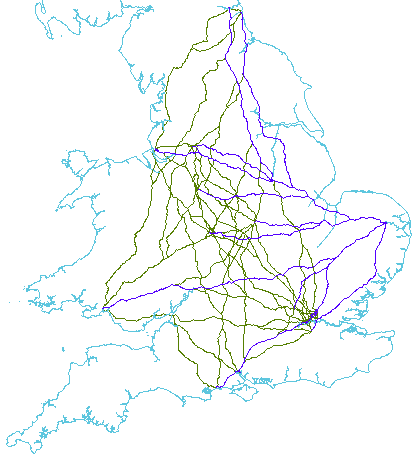
Finally it’s just a case of measuring those routes and adding those measurements all together.
If you’re an FME user – and why wouldn’t you be – I published the workspace and data for you to download if you wish. If you run it on another set of data – like a different league – do let me know how well it works for you.
If you aren’t an FME user, but like the idea of crunching spatial data like this, you can download an evaluation copy from our website. Or if you have Google Earth, here’s the dataset of your team’s shortest journey routes.
Oh! And look underneath for some bonus FME/football content.
Cheers

Bonus Content!
The Road Most Travelled
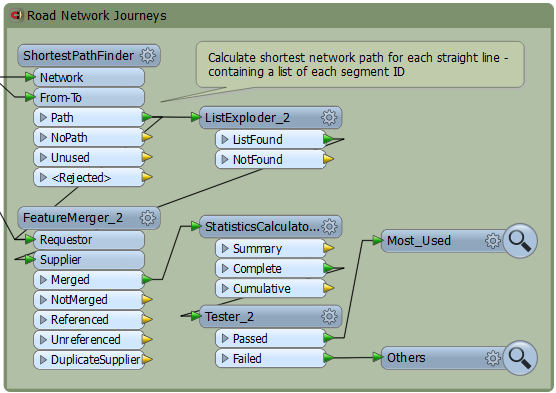
Looking at the travel map above, it did occur to me to wonder which stretch of road is used most times by travelling supporters (were they to all take their shortest route). Can we do it with FME? I got thrown by duplicate IDs in the OS data, but yes, you bet you can!
We simply have to create an FME list of road segments for each route, explode that list, compare it to the original segments, and then count the number of unique segment IDs; like so:
So, the most popular road for football fans is (or should be) this section of the A5 between Northampton and Luton…….
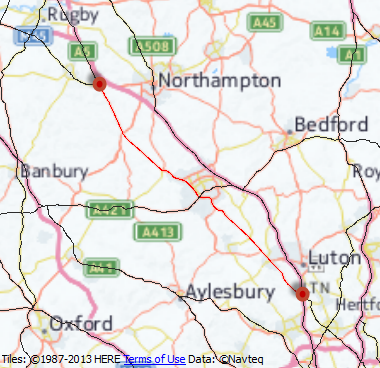
There are 78 matches during the season where the shortest route between the two grounds includes this stretch of road. Conversely, a number of segments are only used twice – for example the A47 between Leicester and Peterborough is only used when Norwich play in Leicester (or vice versa). For other away games in the Midlands the shortest route for Norwich fans runs further south through Corby.
Who to support?
The first law of geography states that the closer two things are, the more they are related. That means the closer you are to a football club, the more likely you are to support them; although I’d amend that to add, you’re also very likely to absolutely loathe the second-closest club, so it’s not a perfect relationship!
Anyway, I ran the club locations through the FME VoronoiDiagrammer transformer to come up with a map…
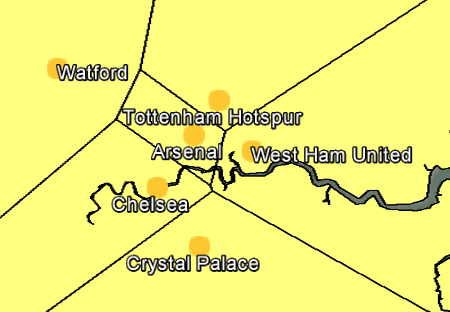
…that shows which club you are closest to. If you live in Britain and want to select a premier league team on a geographic basis, this KML dataset of the above is just what you need.
NB: As before, this article contains Ordnance Survey data © Crown copyright and database right 2014. See here for the full OS OpenData license.

Mark Ireland
Mark, aka iMark, is the FME Evangelist (est. 2004) and has a passion for FME Training. He likes being able to help people understand and use technology in new and interesting ways. One of his other passions is football (aka. Soccer). He likes both technology and soccer so much that he wrote an article about the two together! Who would’ve thought? (Answer: iMark)