With LiDAR sensors showing up in smart cities, UAVs, film production, cars, phones, and much more, point cloud data has evolved significantly since the last time I blogged about it in 2013. Fun fact: that was my first blog at Safe. Over 120 posts later, it’s time to revisit this awesome data type.
In the original post, I noted how in 2007, our users were working with point clouds representing one point per square meter, while at the time of writing, our users had data representing eight points per square meter. Today, point clouds typically represent landscapes, buildings, objects, and more with millimetre precision.
Point clouds today are denser, higher quality, and ubiquitous. You’ll find LiDAR scanners across many industries, from aerospace to telecom to utilities. Let’s look at how companies all over the world are using LiDAR and how you can use data integration workflows to transform, map, and process your point cloud data. We’ll talk about 4 major areas:
- Integrating point clouds with other data, e.g. to make a colourized 3D model or generate an easily shared map
- Preprocessing a point cloud by updating values/components, reducing the size, or changing the structure
- Extracting or filtering out certain points via clipping, splitting, and more
- Analyzing a point cloud through calculations and expressions
[Webinar] 5 Ways to Improve Your LiDAR Workflows
But first: LiDAR technology layers
Working with point clouds involves a few layers of technology: a LiDAR scanner, a place to store the point cloud data it collects, and a data integration platform to process and analyze it. This blog focuses on the data integration part, which is done with FME.
FME Workspaces are used to read, write, and transform point cloud data in custom ways—and FME handles point clouds optimally, processing them as a single feature instead of processing each point individually. Automations can then be used to run the workspace as part of an event-based workflow, which reduces manual effort and frees up time and resources.
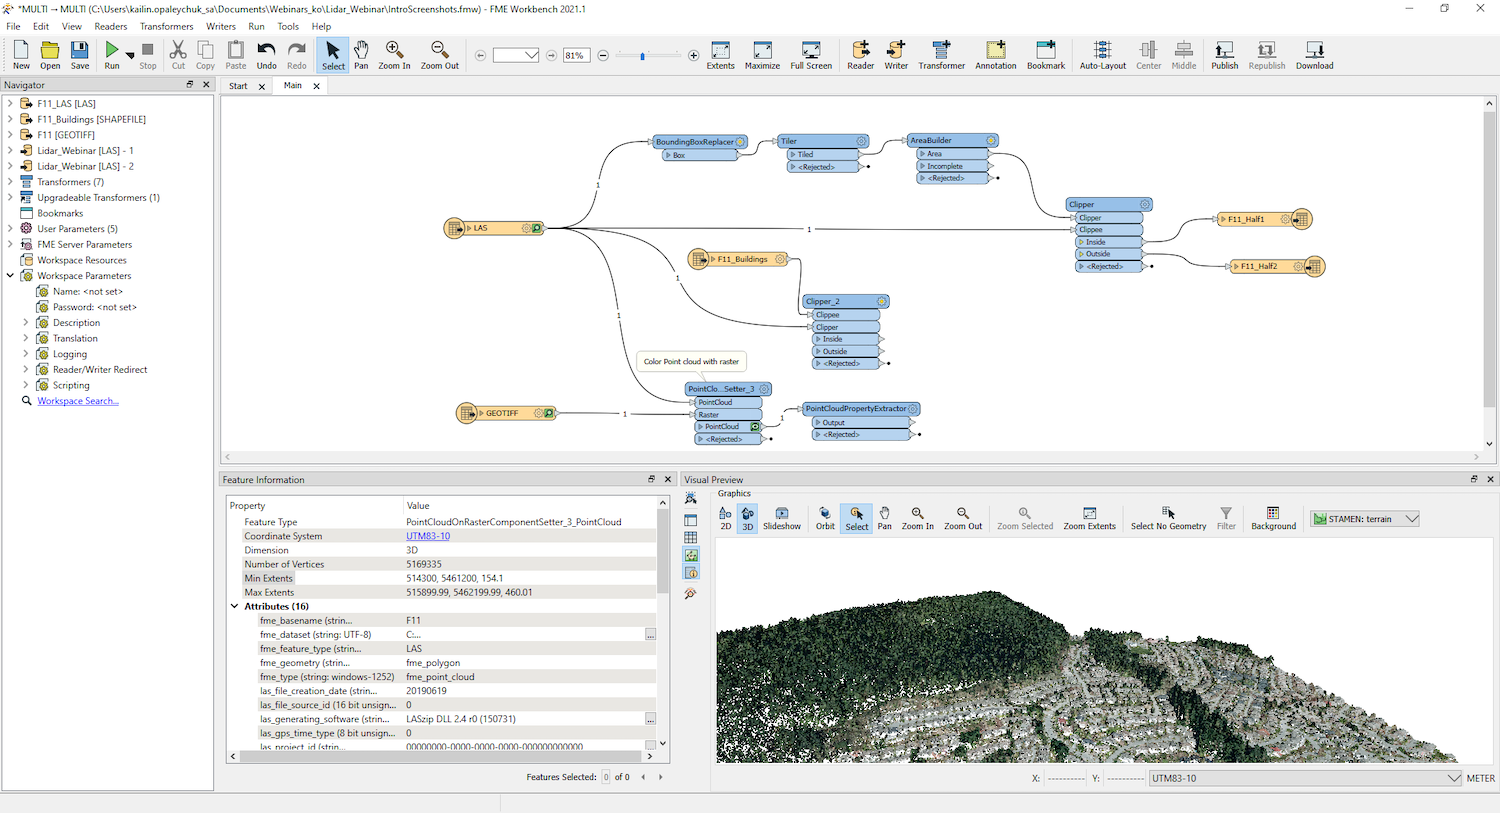
This FME Workspace reads and transforms a LAS point cloud. The user is inspecting the source data in the Visual Preview pane.
1. Integrating data types for a more valuable dataset
Converting point clouds into other data types is often useful. For example, you can convert to a digital elevation model to share it as a raster, into a surface model, or into point/multipoint geometries if you want to load it into software that doesn’t support point clouds. FME can translate between 19 different point cloud formats (as of 2021) and hundreds of other data formats, like GIS, CAD, raster, database, and everything else listed in our integrations gallery.
The City of Calgary used FME to convert the LiDAR scans into a DEM and a multipatch geodatabase, which were then used to calculate elevations throughout the city. This lets them quickly check building elevations during a flood.
Point clouds can also be combined with other point clouds (this is the second most common point cloud task our users perform), as well as with other data types for mapping, sharing, analyzing, and more. For example, integrating the data with a raster enables you to add colour, and integrating with CAD or GIS data lets you augment the point cloud with additional information.
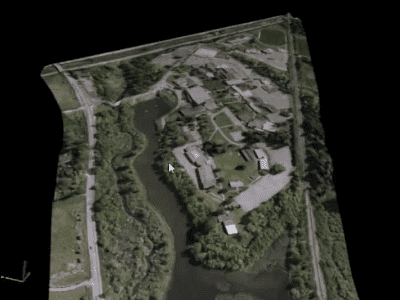
A CAD file in DGN format is used to define the project boundaries for this E57 point cloud, and an ECW raster is used to define the colours. The result is converted to a surface and exported to a 3D PDF for easy sharing.
Creating a 3D model
Many users want to create 3D models out of point clouds. In fact, surface model transformations are one of the most popular point cloud tasks. A number of FME transformers can be used to do this, depending on the nature of the data and the desired result.
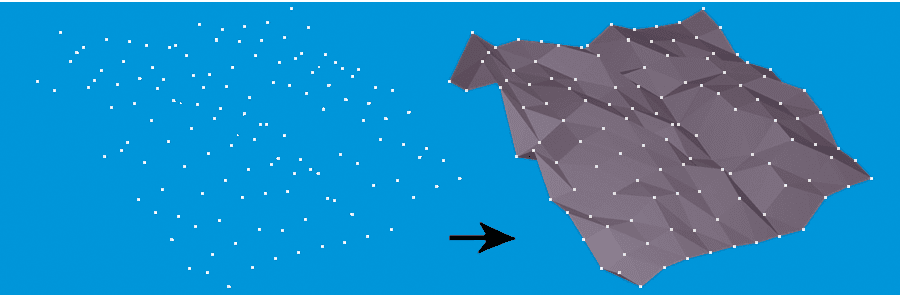
The TINGenerator is one transformer that can be used to create a surface model from points.
Genovum in the Netherlands created a tool that generates 3D models from 2D and LiDAR input data. The 3D models are then used for urban planning.
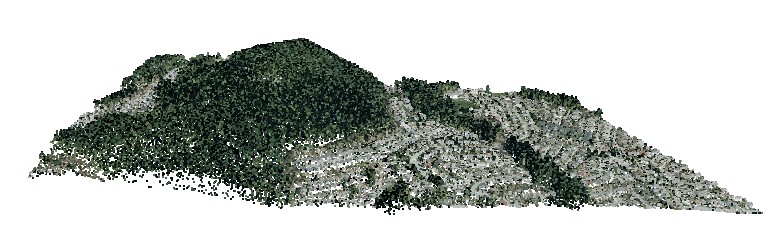
Taking things a step further, The City of Oslo created a 3D printed model of the city at a scale of 1:1000. Starting with a LiDAR scan of the city, they used FME to filter out the terrain, texturize that with a geoTIFF, then convert the buildings into 3D models and attach them to the terrain. The printed 3D model measures 7.6 x 4.5 meters.
2. Preprocessing, cleaning, and restructuring a point cloud
Preprocessing LiDAR data can involve a number of steps. First, cleaning: checking the data for correctness, completeness, and compliance is important in any workflow. Next, it’s important to update the point cloud to contain all information necessary for analysis.
LiDAR workflows often involve many processing steps. RIEGL Laser Measurement Systems uses FME to process LiDAR data in their own RDB format and process it in various ways, like removing extraneous points, echoes, and deviations. One forestry use case involves extracting surfaces, normalizing the heights in the dataset, calculating mean tree heights and point cloud statistics, and outputting 3D tiles in a Shapefile.
Preprocessing a point cloud – screenshot from our LiDAR webinar.
Working in the right coordinate system
If you’re interested in mapping your point cloud, LiDAR data can be converted to another coordinate system (UTM, StatePlane, etc.) using the CsmapReprojector transformer. For example, WSP is a geomatic and engineering company that uses FME to perform coordinate system reprojections on LiDAR data, among many other tasks.
Adding colour
Often, a point cloud needs to be colourized. A common way to do this is by gathering RGB values from a raster and setting each point’s colour. There are many ways to update a point cloud based on expressions, calculations, and external datasets.
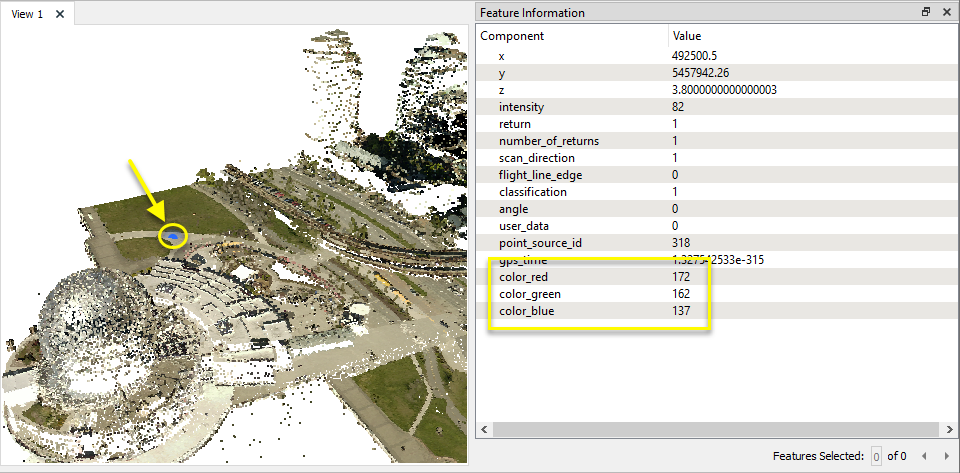
This point cloud has been colourized by getting RGB values from a raster. The user is inspecting a point in FME to view its RGB values.
Reducing the size
Thinning a point cloud is a way to reduce its overall volume by reducing the number of points (e.g. removing every Nth point). This is often done to speed up processing time on a massive dataset.
Point clouds can be thinned by uniformly removing points from the dataset.
A way to speed up processing time without modifying the data is to tile the dataset during processing. Tiling a large point cloud and using parallel processing is a good way to make an FME workflow run faster. Tiles can also be a good way to share or deliver a large point cloud.
Other ways to reduce the size of a point cloud include clipping, slicing, and splitting, which are discussed below.
3. Extracting or filtering only certain points
There are several ways to extract just the desired region from a point cloud. This is a common task because point clouds are so huge that it’s a waste to process and share more data necessary. It’s better to extract just the region of interest.
Clipping a point cloud is one of the most common tasks our users perform. This is when you define a boundary and keep only the points within that boundary. The clipping shape can be a 2D polygon or a 3D solid.
Another option for keeping only a specific region is to slice or profile the point cloud. Check out this tutorial for an example of how to use a Shapefile with a LAS point cloud to accurately identify cross-sections along a highway.
Extracting different parts of a point cloud can also be done based on component values. For example, we can remove points that have a certain classification, colour, or intensity.
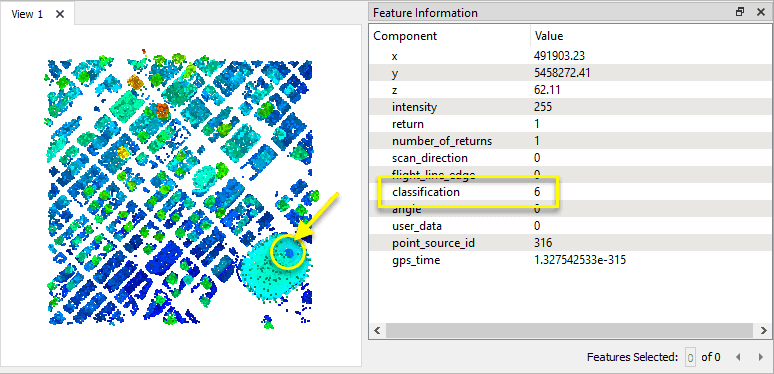
In the above image, the user has extracted only the buildings from a point cloud by splitting or filtering the points based on their classification. A user could also extract water or other reflective surfaces by filtering out points with high intensity values.
CN Rail used these methods to extract precise train track centerlines and assets from LiDAR scans. Accuracy and precision are critical for safety, so they used FME to perform the calculations and analysis automatically.
4. Analyze components and values to generate insight
A point cloud can be analyzed to gather insight into the data it represents. This usually involves several preprocessing steps, like integrating other sources, before analysis is performed.
Users can calculate statistics on a point cloud (for example, finding the min and max values of some component so you know the extents of the dataset). Then, test the data for certain criteria or an expression and route the output as needed, or perform calculations on every point.
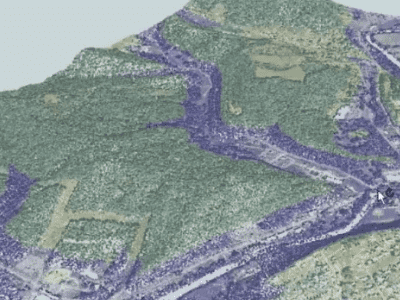
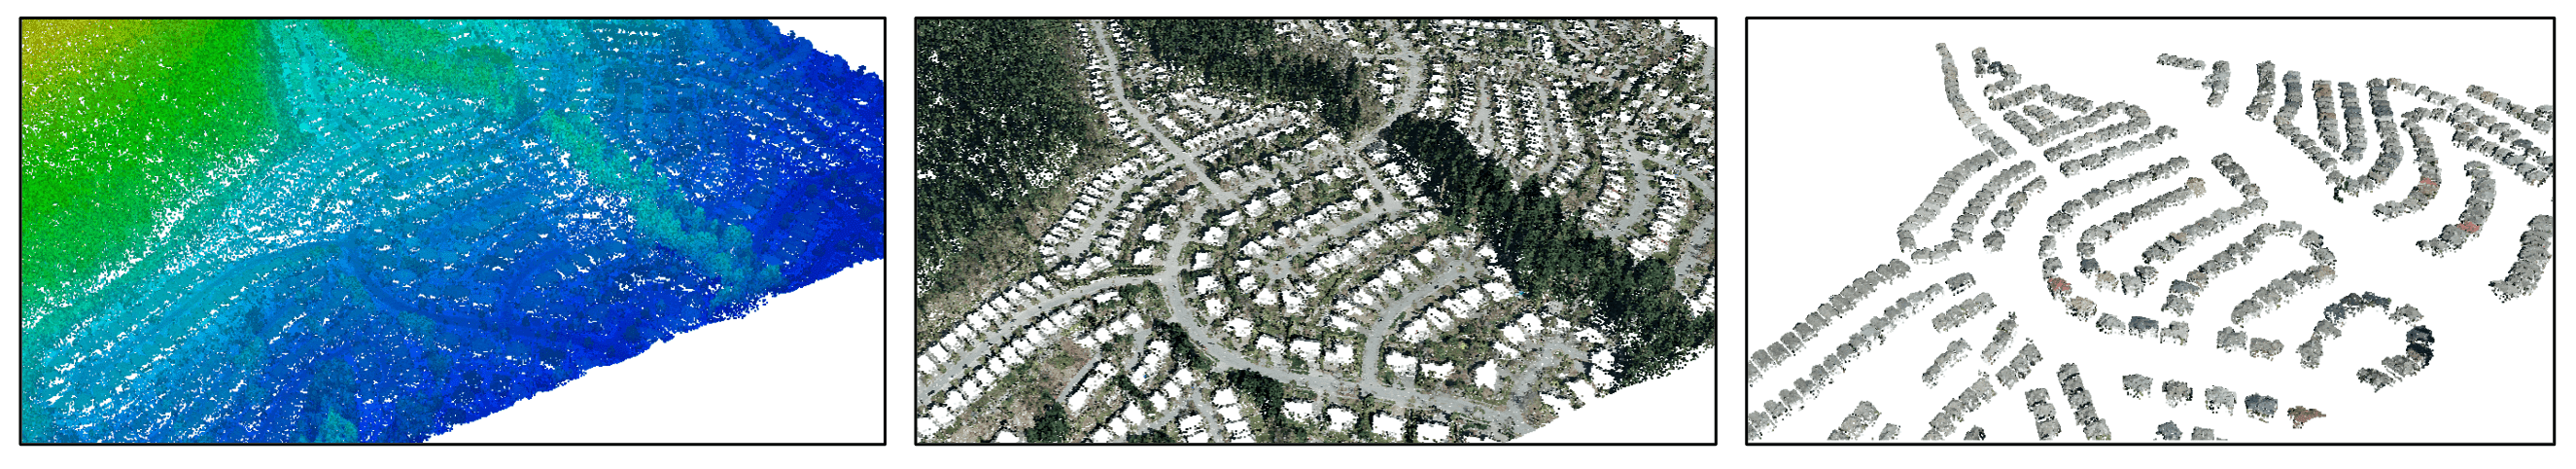
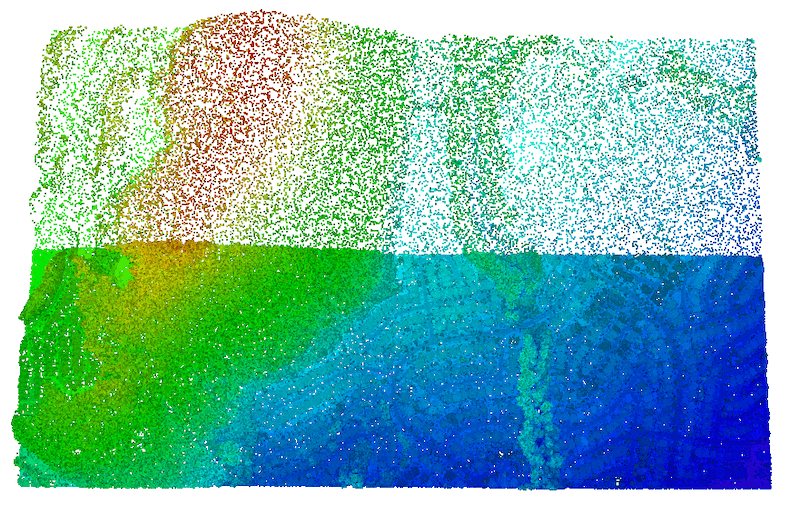
In this point cloud, calculations were applied to every point in order to generate a visualization for flood predictions. Every point below a certain elevation is set to blue, and every point above is set to a colour from an overlaid raster.
Finavia, who manages Finland’s airports, generates flight obstacle maps by integrating LAS point clouds, analyzing the data, and identifying high elevations. They use FME for this and many other workflows to improve the safety and operations of 21 airports.
Bonus: Automate the workflow
Performing any of the above tasks as part of an event-based workflow is the next step in making data processing hands-free. Workspaces can be run on demand whenever a user requests it, on a schedule, or in response to a trigger. Once the workflow is complete, reports can be generated and sent to stakeholders. Data can be moved to a new directory, or any number of other tasks. Check out our FME Server page for more inspiration about automating workflows.
Sign up for our LiDAR webinar to learn how to do the above tasks and a lot more! Also check out our Tutorial: Getting Started with Point Clouds and our LiDAR and Point Cloud Data Integration webpage to learn more.

Tiana Warner
Tiana is a Senior Marketing Specialist at Safe Software. Her background in computer programming and creative hobbies led her to be one of the main producers of creative content for Safe Software. Tiana spends her free time writing fantasy novels, riding her horse, and exploring nature with her rescue pup, Joey.