There’s just no resisting the appeal of the hexagon. For starters, nature surrounds us with it. Whether you’re looking at honeycombs in a beehive, the compound eyes of an insect, or the center of a snowflake, you’ll be sure to find a hexagon. We find them all over our built world too. For example, the nuts and bolts that hold it together most commonly take this shape, and their inherent structural integrity causes them to pop up in building materials wherever low mass and high strength are a requirement.


On top of all this, hexagons have a couple of significant mathematical properties. Firstly, they, like their square and triangle cousins, can be laid out with regular spacing to completely cover a surface. But, unlike their geometric cousins, they have the unique property where the center of every hexagon is equally distant to the center of all of its neighbours. Taken together, it seems inevitable that hexagons would find their way onto maps.
Inevitable it was. Whether mapping to create board games or to make sense of the world, the six-sided hexagon was just begging to be put to use to help us reason spatially. After all, spatial analysis is all about segmenting the world to understand the differences and commonalities between locations.
Hexagons in Geography
Central Place Theory
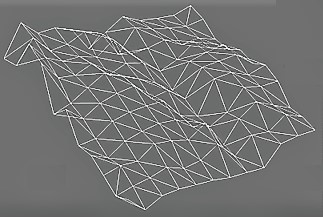
Before making their way into the world of GIS, hexagons were used to analyze maps as far back as the 1930s. Central place theory provided a framework to understand how residential systems were interconnected based on central locations within neighbourhoods. While a triangular lattice was used to segment the regions, central locations were best represented as the center of a hexagon. This was also the most efficient way to represent central areas as it meant that all parts of a map would be covered without the problem of having overlapping areas that circles would inevitably create.
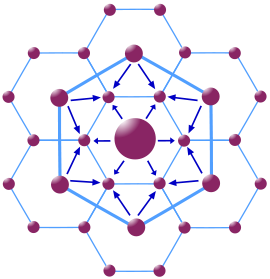
When tiled, the hexagons center is equal distance to its vertices and the centers of the surrounding hexagons. Credit: Wikimedia
Infinite Tiling
When selecting a shape for segmenting a map, it is critical that the chosen shape can be tiled to cover the entire space fully. Squares, triangles, and hexagons all fit the bill. However, each come with their own sets of pros and cons.
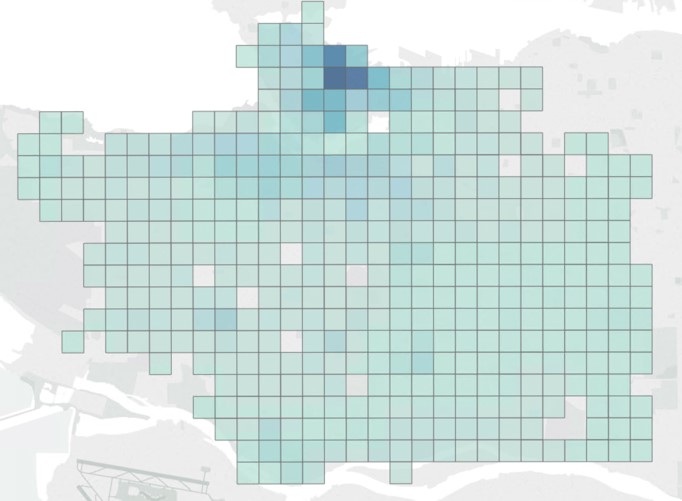
Similar to choosing a coordinate system, choosing a tiling method for your map is entirely dependent on the work that you’re doing, the area you’re presenting, and who you intend to share your work with.
How to Use Hexagons for Hexagonal Tiling and Hex Grids
Once you’ve decided that you want to partition your space and aggregate your data for analysis and presentation (and you’re convinced that hexagons are the way to go), you need a way to assign each point to a containing hexagon. This is often done by pre-generating (or downloading) a coverage of hexagon polygons to cover your area of interest and using spatial overlay operations to map each data point into its hexagon container.
However, if you have the right math and you define a global multi-resolution grid of hexagons, then you can just make a call to a library, such as Uber’s H3, and get back an ID for the hexagon containing your data.
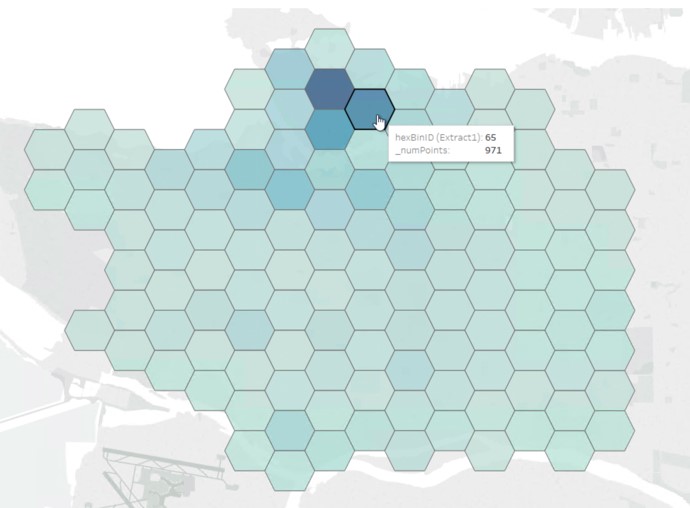
But one way or the other, once you have your hexagons and you have accumulated your values, you are ready to visualize your results. Extrude into 3D hexagonal columns, or make heatmaps – the choice is yours, and the tools are ready and plentiful.
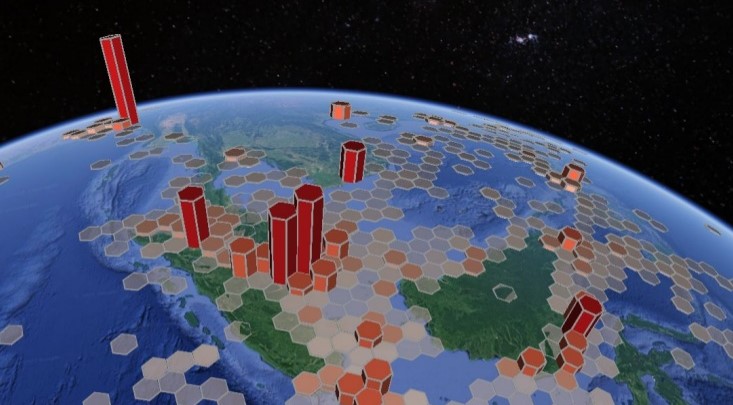
Learn more about this heatmap presenting piracy hotspots using hexagons in this demo.
Hex-ifying Data
As you can tell, using hexagons for tiling maps and spatial analysis is nothing new. This means there are plenty of options available for you to learn about and make use of. The internet is full of stunning hexagonal analyses made with ArcGIS, Tableau, R, and most recently Unfolded.
ArcGIS
If you’re a part of the GIS community, you need no introduction to ArcGIS. They’re one of the go-to softwares for creating beautiful maps, so it’s no surprise that they support thematic hexagonal mapping. Their tools also allow for some additional analysis so you can both present a hex map alongside some outputs.
If you have data you’d like to use in ArcGIS, but it needs some work before being hexed, use FME to transform your data or integrate multiple datasets. FME works well with Esri products and is even a part of the Esri Partner Network! With support for shapefiles, geodatabases, and even ArcGIS Online, FME can help you optimize before you hexa-nize.
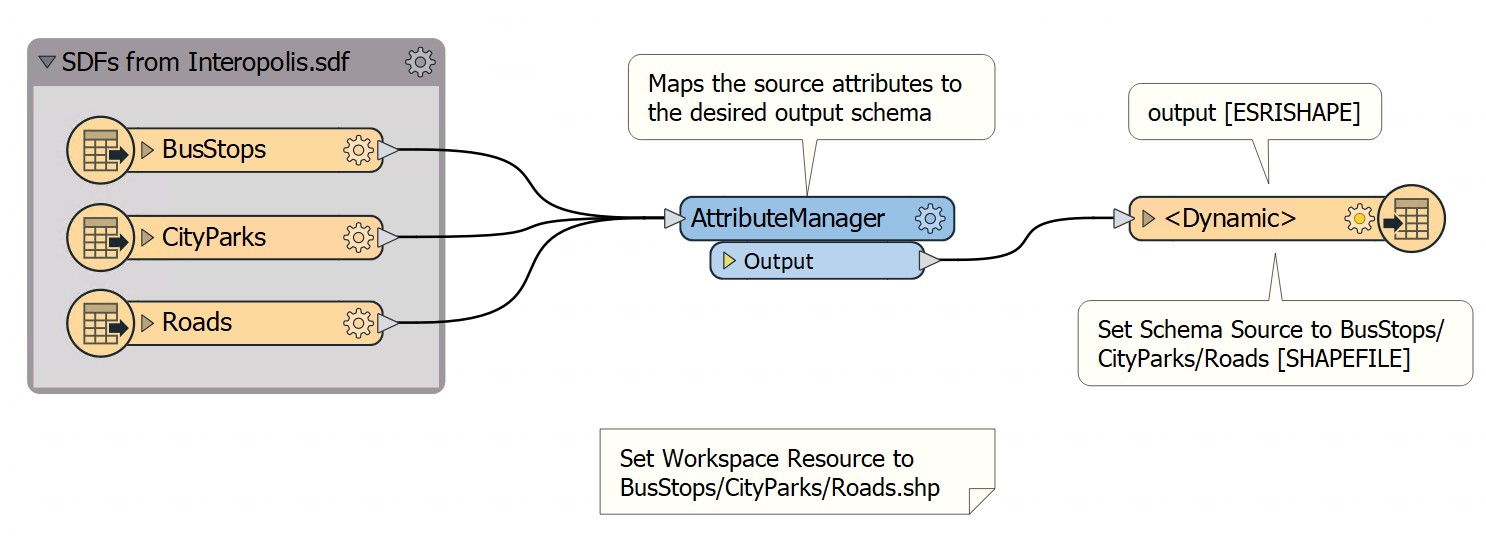
This FME workflow is used to convert Autodesk MapGuide Enterprise SDF data to shapefile.
Tableau
Mapping in BI? That’s right. More people are realizing the power of spatial data, and as a result, many technologies have built-in geospatial support. For Tableau users interested in hexagon tiling, a bit more customization may be required.
Again, this is where FME can help. With tools like the HexBinner, a transformer that encloses point feature inputs and aggregates data into a grid for further analysis, the process can be relatively straightforward.
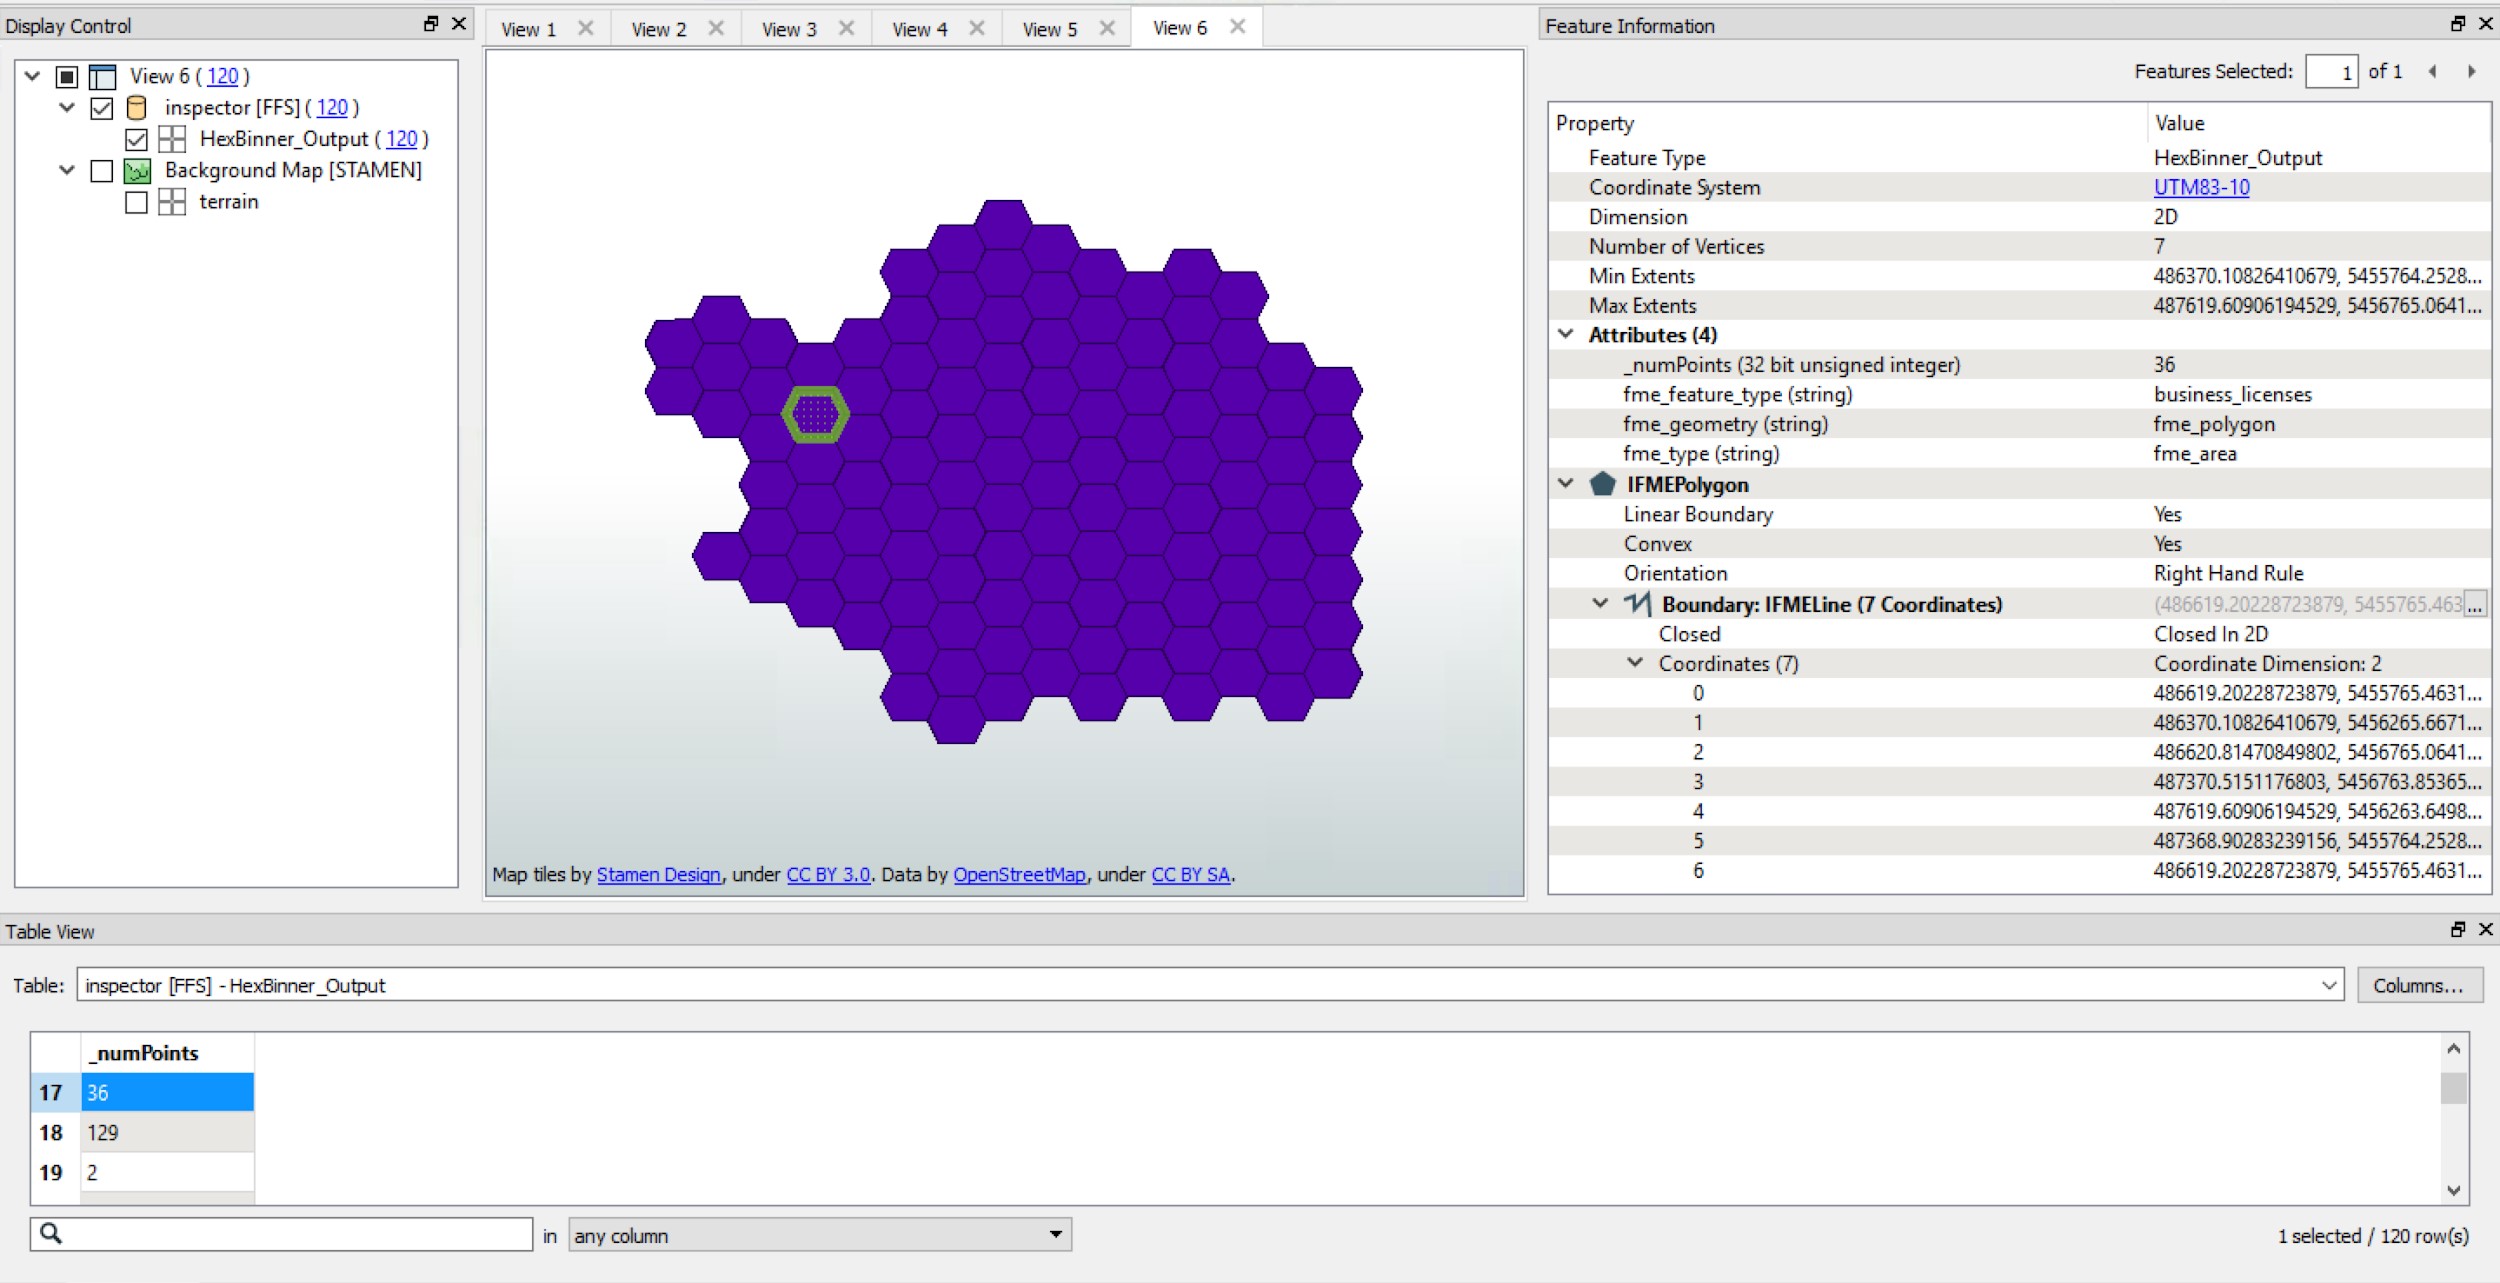
To learn more about using the HexBinner with Tableau, see “Creating Density Maps with FME for Tableau”.
Uber’s H3
The open-source Uber H3 Library was invented to enable Uber to analyze the dynamic nature of ride supply and demand. H3 defines a 16 level hierarchical grid of hexagons with global coverage, assigning a unique ID to each hexagon at each level.In addition to being able to compute a containing hexagon from a point, it can also fill polygons with hexagons, as well as determine parent/child and neighbour relationships between cells. Provided that exact containment is not a requirement, H3’s indexes are able to turn many otherwise spatial problems into purely relational ones, making H3 very valuable for the analysis and storage of very large datasets.
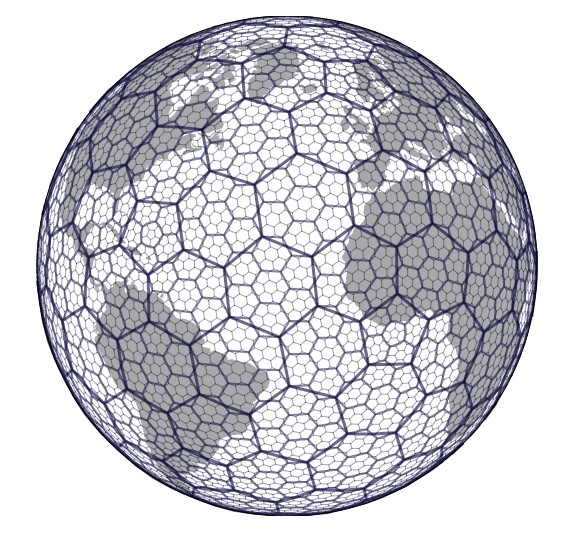
H3 enables users to partition the globe into hexagons for more accurate analysis.
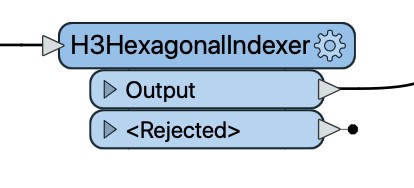
Over the past couple years it has found its way into programming languages like Python, R, and Javascript, as well as applications as diverse as Google BigQuery, PostgreSQL, and FME.The H3HexagonalIndexer, which will be released as part of FME 2021, provides easy no code access to key H3 operations. Just put down an H3HexagonalIndexer, connect your input and output, choose your operation, and enjoy some hexagonal goodness!
“It’s All About the Hexagons, Baby”
Because of FME’s extensive format reach, having ArcGIS, Tableau, and H3 available as options for easy use within a data transformation makes it easy to apply the power of hexagons to a wide variety of spatial problems.
In our webinar “Hexagonify the World”, we showed how H3 in FME can be used to quickly produce outputs of aggregated piracy incidents, filter spatial data coming from an IoT stream, and analyze snowy owl migration patterns. And, as a bonus, you can also learn more about how to create your own HexArt!
To paraphrase Weird Al, “It’s all about the hexagons baby”. This humble shape has never been easier to inject into your spatial data transformation workflows, whether to prepare that data for visualization and presentation or to turn your big spatial data problems into more easily manageable big data relational problems. Don’t delay! Go forth and hexagonify!

Dale Lutz
Dale is the co-founder and VP of Development at Safe Software. After starting his career working spatial data (ranging from icebergs to forest stands) for many years, he and other co-founder, Don Murray, realized the need for a data integration platform like FME. His favourite TV show is Star Trek, which inspired the names for most of the meeting rooms and common areas in the Safe Software office. Dale is always looking to learn more about the data industry and FME users. Find him on Twitter to learn more about what his recent discoveries are!


