There are literally thousands of accepted ways to measure and view the world in 2 or 3 dimensions. And each of these methods is defined by a coordinate system. There are more than 1000 different ways to draw a map but fear not, this is Coordinate Systems 101. You want the basics — we got you covered.
What is a Coordinate?
A coordinate is a specific point on a line, scale or surface.
When it comes to maps, coordinates are numeric values used to represent specific points on the Earth. These are often communicated in pairs — a horizontal X value and a vertical Y value like 49.178010°, -122.842655° (aka. latitude and longitude).
Coordinates are an extremely useful piece of data in a variety of industries. Surveyors need to know exact points on the Earth at which to build, utilities need to be able to place networks in specific locations underground where they won’t be disturbed, and telecommunication services need to know exactly where to place service towers to support their clients. Without coordinates, life would be pretty chaotic (uncoordinated, one could say).
However, without any context or rules, these are just numbers. They could be anywhere! Or mean anything! It’s like they are lacking some kind of system to define them or something!
What is a Coordinate System?
The English language defines ‘coordinate’ as a verb. It means “to bring into a common action, movement, or condition”. Conveniently, a coordinate system does just this.
A coordinate system defines a common set of conditions or rules that apply to all of the coordinates located within it. You could say a “Coordinate system systematically coordinates coordinates.”
But, it’s not always simple. The thing is, the Earth is a really weird complex shape, not a smooth and perfect sphere. It’s more like a lump of play dough shaped into a ball by the small, clumsy fingers of a toddler. Mountains, valleys, plains, fjords, canyons, and so much water. To top it off, it’s not static. The gravity of the moon acts on the oceans, tectonic plates continue their slo-mo movements of nudging continents around, and even the poles shift.
So you can imagine, when people took a look at this problem of locating places on the crazy-shaped-always-changing-Earth, they had a lot of different things to consider. Some looked at specific regions like a province, while others created systems that were oriented around tidal levels. Others ignored both of these things and chose something else entirely.
This is why we have thousands of geographic coordinate systems — because there are a lot of right answers depending on what you need.
These thousands of coordinate systems are able to co-exist because they are each defined by a common set of rules or properties. At a high level, geographic coordinate systems all have:
- A datum – remember, the Earth is a playdough sphere. A datum is the mathematical frame of reference that approximates the 3D shape of the Earth for the purpose of measurement. This can be a perfect sphere like a classroom globe, or ellipsoidal and flattened, and is often shifted off the center of mass of the Earth in order to provide more accurate measurements.
- Angular units – The measurement used to describe the angle of a point on the Earth’s surface in relation to the center of the Earth. The most common angular units used are decimal degrees (DD), degree minutes seconds (DMS), and decimal minutes (DM).
- Prime Meridian – the line running north-south along the Earth’s surface indicating 0° longitude. The most commonly used prime meridian is the one running through Greenwich, England.
Geographic Coordinate Systems vs. Projected Coordinate Systems
Thinking back to my classroom days, and spinning a globe to determine my future, I realize I could have played this same game with similar results with the flat hanging map on the chalkboard. Could my friends and I not have chosen to spin ourselves dizzy, then stumble-walked towards the map, and pointed out a location that way?
Yes, we could have, if our teacher hadn’t rolled his eyes and called us disruptive, threatening to take away recess.
We would have been able to do this because a projected coordinate system had been utilized to translate the 3D reality of our world (aka. A globe that uses a geographic coordinate system) to a flat 2D depiction. Handy for human interaction and classroom mischief (or learning).
Geographic Coordinate Systems
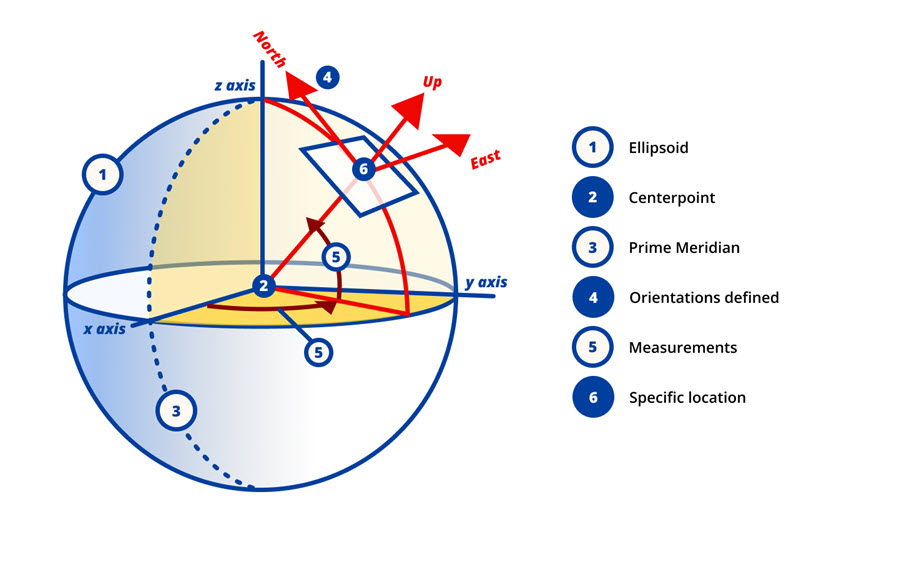
Now that you know that a geographic coordinate system (GCS) is made up of a datum, angular units, and a prime meridian, let’s see how it actually works. It’s a lot easier to understand if you look at a picture.
- In this diagram, an ellipsoid is drawn. This loosely represents the surface of the Earth.
- A centerpoint is located – this is where the X, Y, and Z axis cross.
- The prime meridian is defined – this is the vertical measure of 0 degrees. This can be in a different location in different coordinate systems.
- The directions of Up, North, East, South, and West are defined.
- Now that orientations are set, you can see how the Earth is divided into quadrants. Moving away from the Equator and prime meridian gives you negative or positive values. These values are coordinates, and can be used to locate anything on the earth.
One of the most commonly used GCS is the WGS 1984 (World Geodetic System 1984). This system is commonly used for sharing global locations particularly with a GPS.
While the information gained from a GPS can be extremely useful, solely relying on a geographic coordinate system isn’t going to solve all your coordinate system problems.
We’ve all seen and managed that “Location” setting on our mobile devices, which enables your phone to measure GPS coordinates. That’s great and all, but imagine just being given a string of numbers from a GPS and nothing else. You’d know exactly where you were, but how in the heck would you ever make it to dinner in time in rush hour traffic without all of those super-secret side street route options being revealed? That’s why Google Maps and Apple Maps are pretty ubiquitous these days for navigating around.
Coordinate data becomes so much more accessible and meaningful to us when it’s moved from a GCS to a Projected Coordinate System (PCS), which takes the where identified in a GCS, tells us how to draw that information to a flat surface (like your phone screen) using a projection method. I know that I would quite literally be lost without projected coordinate systems in my life.
Projected Coordinate Systems
When it comes to a projected coordinate system (PCS), we first need to understand what a “projection” is.
Basically, there’s more than one way to peel an orange. You’ve got a nice, spherical orange, just asking to be eaten. You peel off the skin and pop a slice into your mouth. Yum. The orange peel, once wrapped around your orange, is now able to lie flat on the table because of the ways you ripped through the peel. That first orange was just so darn good, you gotta have another one. Another orange peel lies flat on the table, this one with a different pattern of tears. Projection is just that – the method by which we “peel” the Earth and lay it out flat.
However, when it comes to maps, we aren’t just “peeling and laying the Earth flat”. We’re trying to represent something that’s spherical into 2D as a rectangle (or other shape), in a consistent way without tears to break up the image. There are a number of different projection methods used because moving from 3D space to 2D space will always result in distortion of some kind. Different projection algorithms are selected to preserve as many of the following qualities as possible to varying degrees, but note, all four can never be preserved in 2D:
- Area – how accurate are the size of the landmasses compared to their reality?
- Shape – how accurate are the shapes of features compared to their reality?
- Distance – how accurate are the measurements between two points?
- Direction – how accurately are two locations portrayed relative to each other?
As an example, check out how the Mercator projection works. To put everything on a flat, rectangular surface, countries closest to the poles see a distortion of the area where they end up being displayed larger than they are as they are stretched to fill the rectangle space.
The Mercator projection has chosen to prioritize direction and conformality over area (it was originally designed for marine navigation to help ships sail using compass directions). (Credit: Wikimedia)
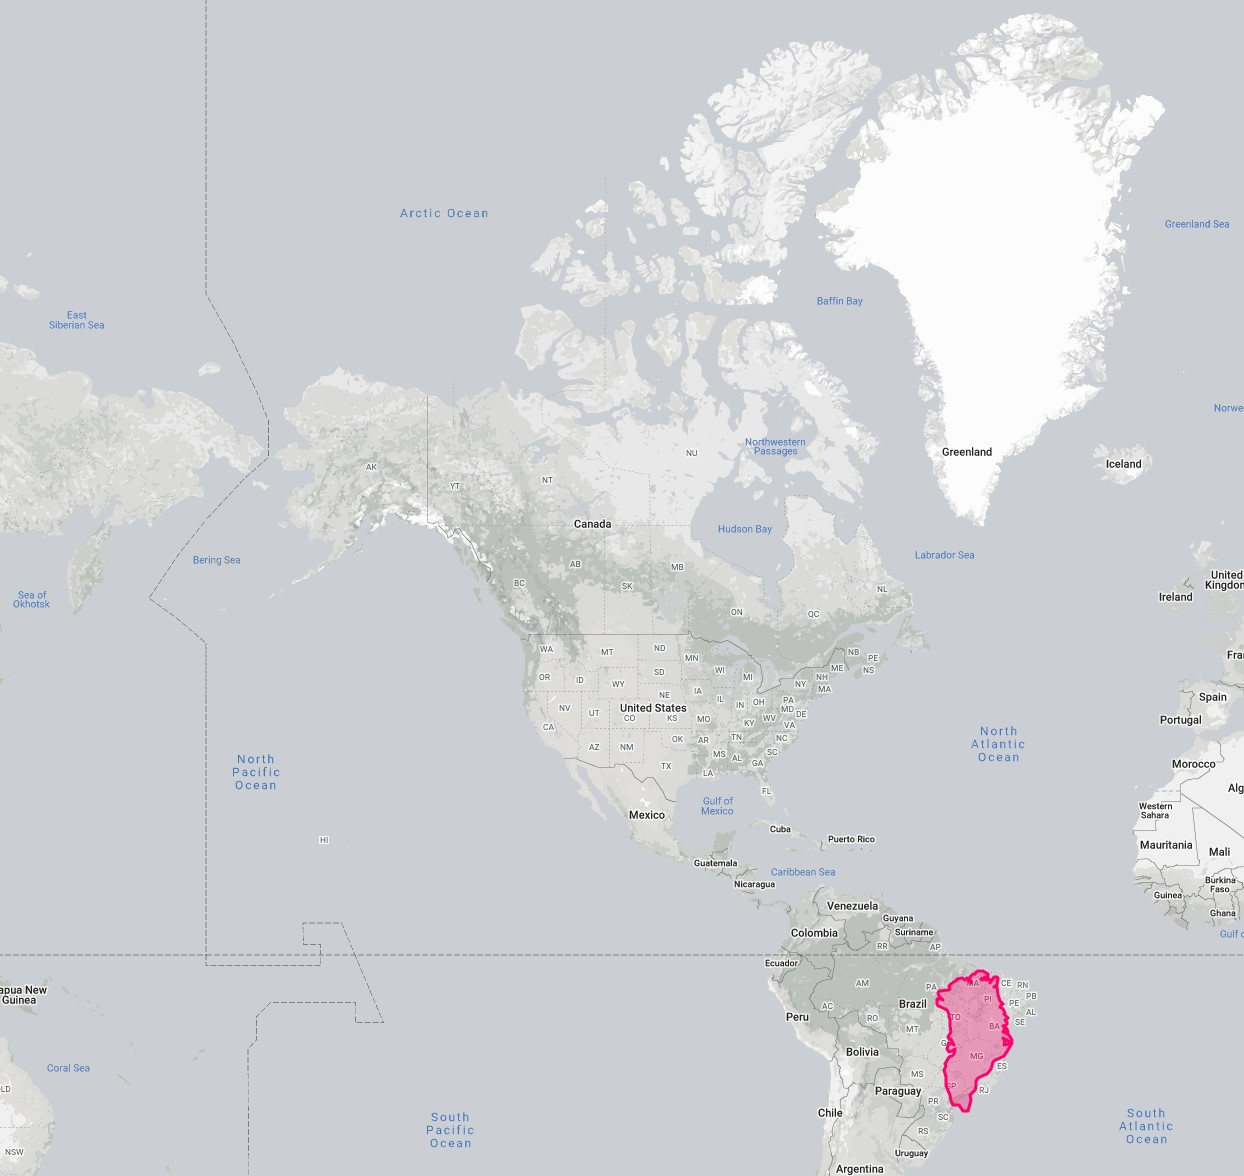
Take Greenland vs. Brazil for an extreme example of the Mercator projection. While Greenland appears to be larger than Brazil in the Mercator projection, in reality, the area of Greenland is 2,166,086 km², and Brazil is 8,515,767 km².
This screenshot was taken from https://thetruesize.com/ – which allows you to experience how Mercator projection has chosen to prioritize direction and conformity over the area (it was originally designed for marine navigation to help ships sail using compass directions).
One additional key difference between a GCS and PCS is that since a PCS is a flat, 2D representation of the Earth’s surface, a PCS will use linear units to measure distances instead of angular units. Units like feet, meters, links, or chains are all commonly used with projected coordinate systems.
What About Local Coordinate Systems?
A local coordinate system optimizes for accuracy for a specific location. These are most often used by local governments, construction teams, and surveyors because the narrower the area a coordinate system needs to cover, the less distortion you need to account for on a global scale when projecting.
This is why we have thousands of coordinate systems — because they have been created and optimized to reduce distortion of the area, distance, shape, direction or any combination of those within a certain location.
For example, the federal government of Canada is dependent on NAD83 (North American Datum 1983) while the province of British Columbia, Canada, uses NAD 1983 BC Albers, which defines a projection method specific to the provincial boundaries.
Reprojecting Spatial Data
As you can see, spatial data can come in all shapes and sizes thanks to the wonderful world of coordinate systems. While having more options gives you the flexibility to do what you want, it also means that everyone else has more options to do what they want. And that can make things tricky.
When it comes to sharing or integrating spatial datasets, you’ll inevitably need to perform data transformation tasks that translate all the data you’re working with to use a common coordinate system. This is what’s called “reprojecting your data”.
Performing reprojections is one of the most common manipulations that needs to happen when dealing with spatial data. While there are various ways to perform a reprojection, one of the easiest methods is using software that supports this function.
Data integration software like FME gives you the ability to perform reprojections alongside other transformation tasks. No matter what your situation is when it comes to using your data, FME has all the major reprojection tasks covered.
You can use FME to:
- Reproject your data to any of the 5,600 natively supported coordinate systems
- Reproject your data to a custom coordinate system you’ve defined
- Apply a projection to spatial data that doesn’t have a defined coordinate system
- Integrate multiple datasets with various coordinate systems into a single output using one coordinate system
- Migrate data from an outdated coordinate system to a newer, accepted standard
All the above being said, the best way to reinforce your understanding of coordinate systems is to get your hands dirty with some data. Grab some open source spatial data, or use the data provided for free in the FME Community to begin! There are a number of relevant tutorials and articles to get you started. Before you begin, make sure to download a free 30-day trial of FME.
Here are some useful resources to help you start coordinating your coordinates:
- A basic article of how coordinate systems are handled in FME
- Follow a quick step-by-step tutorial which introduces you to two different ways to define coordinate systems in FME
Safe prides itself on support and service. Here’s a wide range of coordinate system related information with links to our Community, additional training videos, and tutorials.

Jenna Lyons
Jenna is a Product Owner at Safe. She originally got a BFA in Art and Design. How does one move from painting to tech? That’s a story for a longer bio, but know that her passion is creating, and you do a heck of a lot of that working in product. In her spare time, she likes cooking, crafting, and backpacking.


