Have you heard of citizen science projects like the Great Backyard Bird Count or EarthEcho Water Challenge? They are examples of increasingly common and powerful research partnerships forged between scientists and volunteer data collectors from the non-scientific community. It’s no wonder this arrangement is growing in popularity. Volunteers report a sense of empowerment as they contribute to a greater understanding of the world around us. Scientists, like me, build a connection with the community, and get oodles and oodles of data. While rich data sets are a blessing, they also present a challenge for data management, timely analysis, and reporting.
MangroveWatch: Monitoring Shoreline Condition via Georeferenced Imagery
My institution, Saint Leo University, works in partnership with the non-profit organization MangroveWatch, whose central mission is the “conservation of mangrove and tidal wetland environments globally”. As a part of that mission, we enlist the help of citizen-scientist volunteers (i.e. MangroveWatchers), to periodically collect video recordings of shorelines where mangroves grow so that we can visually evaluate changes in mangrove condition over time. The MangroveWatchers make their recordings using a consumer-grade video recorder operated from a boat traveling parallel to the shoreline. Volunteers simultaneously record their boat’s position at one-second intervals using a consumer-grade hand-held GPS unit. Once a video recording and a GPS track are submitted to our lab, the video is broken down into still frames (1 frame per second) and each frame is subsequently matched to a corresponding GPS point. Using the assumption that the camera remains aimed at the point of the shoreline lying 90 degrees relative to the path of the boat, each image is georeferenced to a location along the shore that would be visible from each GPS point. The images, typically numbering in the thousands, are then reviewed by a scientist and the results shared with the volunteers and interested entities via maps and summary graphics as rapidly as possible.
Prior to our adoption of FME via the FME Grant Program, the process of transforming videos into a map revealing the condition of an area’s mangroves was laborious, involving several programs, a long list of manual operations, and many superfluous data points. Not only was the process time-consuming, but also fraught with opportunities for human error.
FME to the Rescue!
With FME, we are now able to input a GPX file (from the GPS unit) and the folder containing the still frames derived from the video, hit “run”, wait a few minutes, and everything is made ready for immediate shoreline assessment. Each still frame is matched to a boat position, and then to a position along the shoreline; one photo is automatically selected as best capturing each 10 m shoreline segment.
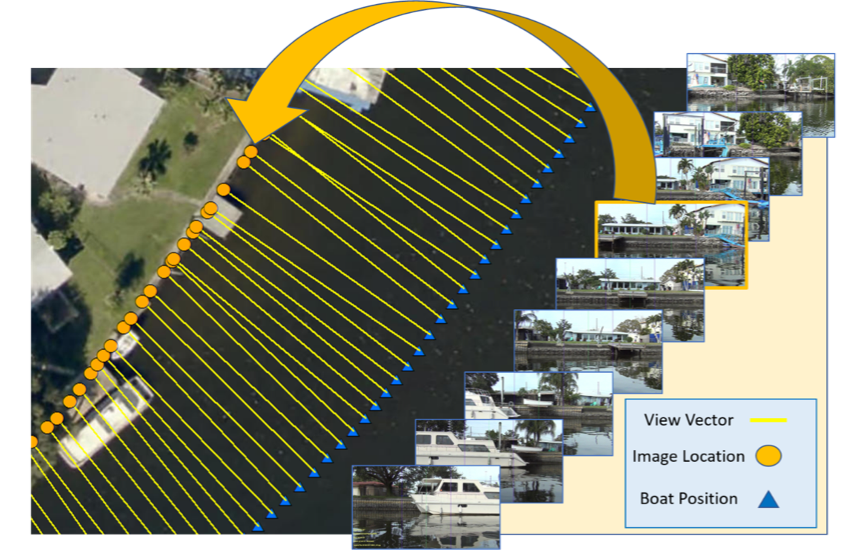
With FME, a View Vector is generated from each 1-second boat position. The intersection of the View Vector and the shoreline is the approximate location of the center of the still images.
But wait, there’s more! Each selected image is copied to a new folder and renamed with a unique shore segment identifier. Each image is stamped with a survey title, segment ID, latitude and longitude, date of recording, and the original filename. An Excel spreadsheet that will receive the scientist’s evaluation scores is generated by the FME Workspace. The sheet includes a relative path hyperlink to each image for easy access and review.
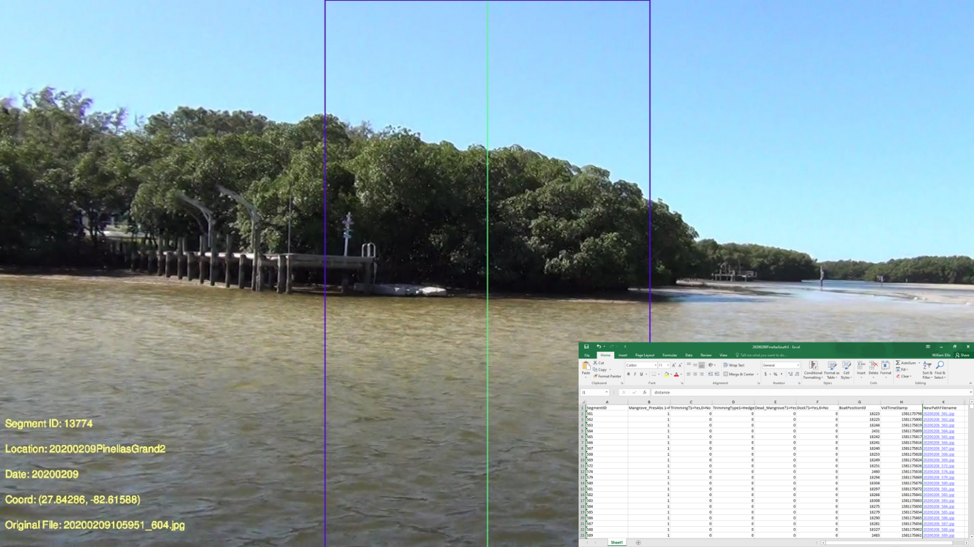
FME stamps each image with relevant metadata (e.g. Latitude, Longitude, date, etc.) and creates an Excel data sheet (inset) containing a hyperlink to each image.
Thanks to FME, the bulk of our effort can now be applied to evaluating images instead of preparing for that evaluation. In many instances, we can provide volunteers with an analysis of their shoreline’s condition on the same day that we receive the raw video and GPS data!
Future Directions
Although in this blog post we described a specific application of this FME Workspace to the mission of MangroveWatch, it would work just as well for any application where a visual assessment of a linear feature was desired. Think of it as a budget-conscious Google Street View that you or citizen scientists can generate for any GPS-accessible location. We are currently working to improve the performance of the program when the path of the video recorder is not constant; a weaving path can degrade the quality of the georeferencing. We also hope to include some indication of scale in each image that accounts for the effect of distance and zooming.
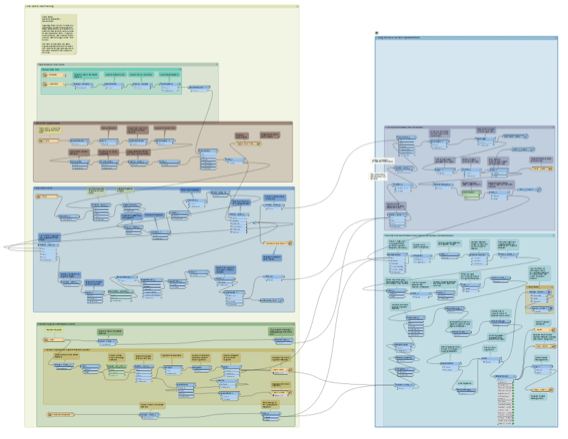
The FME Workspace that powers it all.

William Ellis
William Ellis is an Associate Professor of Biology at Saint Leo University. He has worked with FME since 2016, using it to connect his students and citizen scientist volunteers to the world of ecological monitoring. His special interest is using advancements in “everybody’s got it” technology to better understand the marine and estuarine environment.