By creating a web map or 3D scene using a web visualization library, you can share your geospatial data with anyone using a URL. Here are a few available tools and a step-by-step guide to creating a visualization. See live demos in our on-demand webinar.
The data visualization libraries we’re about to explore have the power to help you build something mind-blowing. Whether you want to share an interactive web map of your data repository, a 3D scene of a building information model, or something else geospatially awesome, the power is all here. You just need two things:
- To decide what library you want to use (I’ll outline pros and cons).
- Knowledge of how to prepare your data and harness that library’s abilities (this is where FME comes in, and below you’ll find a step-by-step guide).
A lot of industries already use these methods for sharing datasets, including local government, aerospace, AEC, real estate, utilities, and more. Just look at Cesium’s user gallery and consider all the websites that have an embedded map as part of their interface.
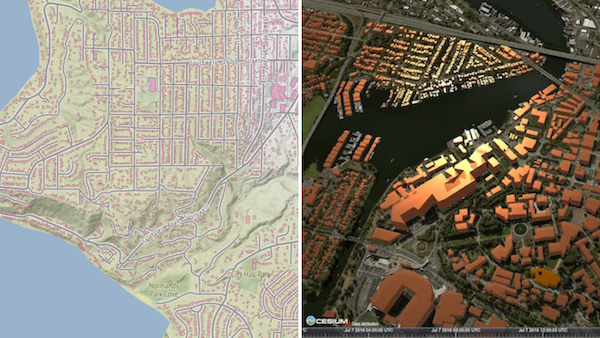
Left: Polygons viewed on an OSM web map. Right: Converted to 3D and rendered in Cesium.
Choosing a web visualization library
Step one. Here are a few questions to ask yourself:
- What kind of data do you need to visualize? For example:
- Display 2D/vector data on a map.
- Let end-users explore 3D buildings, landscapes, or objects.
- Display rich, interactive charts and graphs (not covered in this blog because it’s not geospatial, but if this is what you need, check out D3.js or Plotly).
- Do you need to see the data on a spatially referenced background map?
- Do you prefer a free and open source (FOSS) solution or a proprietary one?
- How much coding are you willing to do?
Got your goal in mind? Here are some options.
Building interactive web maps for 2D data
You’ve got polygons, lines, and points, say in a GIS, and you want to share these on a map in a browser. The below technologies let you embed a map on a web page with varying levels of functionality and work involved.
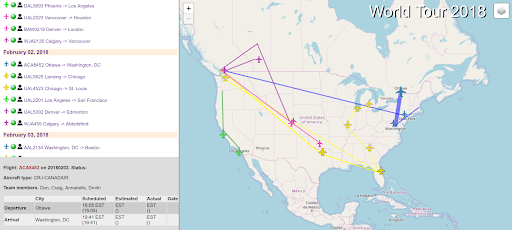
Leaflet web map of FME World Tour 2018 cities.
Leaflet
Powerful and the most lightweight (mere KBs), Leaflet is a straightforward FOSS option for building interactive web maps and data download services. It likely does everything you need for the least amount of JavaScript coding. Plus you get a choice of which basemap you want – OpenStreetMap, Mapbox, Esri, etc.
- Example: Overlaying geospatial video on a Leaflet basemap. In FME, you can skip the JavaScript coding by using the HTMLReportGenerator transformer to generate a Leaflet map.
OpenLayers
This FOSS library is often praised for being more mature and having more features than Leaflet—so if you’re after rich, customizable, GIS-like functionality, try OpenLayers. OpenLayers supports a lot of data formats, so you probably won’t need to convert your data before streaming it to your OpenLayers application.
- Tutorial: Streaming GeoJSON on an OpenLayers basemap.
Mapbox GL
Mapbox is a widely adopted favourite. The key here is the use of WebGL to render vector tiles, making it very powerful (too powerful for older browsers, actually). Note Mapbox GL is different than Mapbox.js, a plug-in built on top of Leaflet that renders raster tiles.
- Steps: Convert your data to Mapbox Vector Tiles (support for this format is coming soon in FME) and pass it to the API for rendering.
Google, HERE, Bing, and other mapping providers
You could use the Google Maps API or another tool from your favourite mapping provider to place your data on a basemap. This is a straightforward option if you don’t need as much control over the end result. You also get access to whatever these providers offer, e.g. Google’s unparalleled navigation and traffic/transit information. But you will have their company logo on your map and their terms of service to comply with (as opposed to a FOSS option).
- Try it: Data download service using Google Maps, powered by FME Cloud (here’s the tutorial).
Building interactive 3D visualizations
You’ve got a building information model, landscape, CAD model, or similar, and want to let people zoom, pan, and explore that 3D world in a web browser. The motivation behind these technologies is that sharing your geospatial data via URL is easier than sending someone a huge dataset or making a non-technical person install the necessary software.
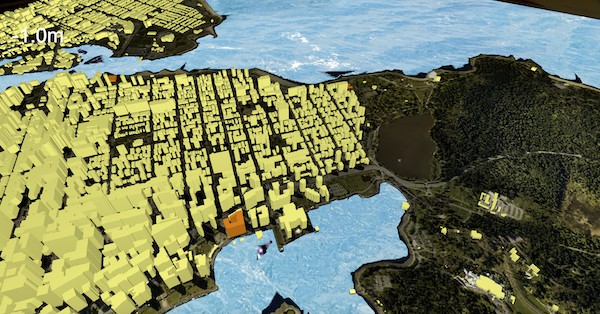
3D Vancouver buildings in three.js
Cesium
Cesium excels in power and accuracy. Use it to see real-world data in an accurate 3D environment, like a landscape or georeferenced building. It’s coordinate system aware, comes with pre-made globes for background maps, and supports tiling. Plus, it’s open source and has a very active community.
To use Cesium, you can either convert your data to the Cesium 3D Tiles format and use the CesiumJS library to build the visualization, or send your data to the Cesium ion platform, which streams the data and automagically generates the visualization.
- Example: Rendering 3D buildings with FME and CesiumJS.
I3S
Indexed 3D Scene Layer is an open specification developed by Esri that has been accepted by OGC as a community standard. It can render 3D objects, meshes, points, and point clouds. The benefit of using I3S is that it’s designed specifically for GIS data and makes it easy to connect to ArcGIS’ geoprocessing power. This technology is fairly new, so we haven’t seen much of it in action yet—let us know what you’re using it for!
- Tips: Convert your data to .slpk format and host it in the cloud for use by ArcGIS. FME has an I3S writer as of FME 2018.1.
three.js
This powerful, lightweight library is designed for everything from gaming to sharing BIM data. Three.js has no geospatial reference but is a great choice if you don’t care about the spatial location of the data—say if you just need to explore a building or 3D object. It also has WebVR support, which means you can build virtual reality scenes.
- Examples: On your mobile device, go to fme.ly/vrhome to see a three.js VR scene. Also, check out this flight simulator demo. You can automate the data conversion and coding process using FME’s ThreejsSceneCreator custom transformer, which outputs the HTML and converted data to a folder that you can host somewhere like S3.
BabylonJS
This is a popular 3D rendering tool like three.js, the key difference being that BabylonJS was specifically designed to be a gaming engine. While BabylonJS has less functionality than three.js, it does have a more controlled dev cycle (by Microsoft).
- Tips: Babylon files are just JSON. We haven’t tried converting to Babylon with FME, but if you try this and/or if you would like to see a native Babylon writer in FME, please let us know on the FME Knowledge Center!
Optimized 3D format: glTF
glTF, or GL Transmission Format, is like the JPEG of 3D data. It’s a fantastic open specification that represents 3D surfaces and optimizes the size of the asset. It’s supported by three.js and CesiumJS, so you could write to this format instead of Cesium 3D Tiles or JSON.
Note glTF doesn’t support attributes, but you can work around this by writing a JSON array in parallel that contains all the attribute information.
Get started: step-by-step guide
Whatever tool you choose for your web map or 3D scene, the process is roughly the same. We’ll demo these steps during Wednesday’s webinar.
- Prepare your data so it meets the library’s requirements. This data preparation phase is where FME comes in. Your FME workspace will likely involve blending data sources, converting the data to the acceptable format, checking for errors and repairing them, and in some cases, simplifying the data so you aren’t sending unnecessarily complex data to the web.
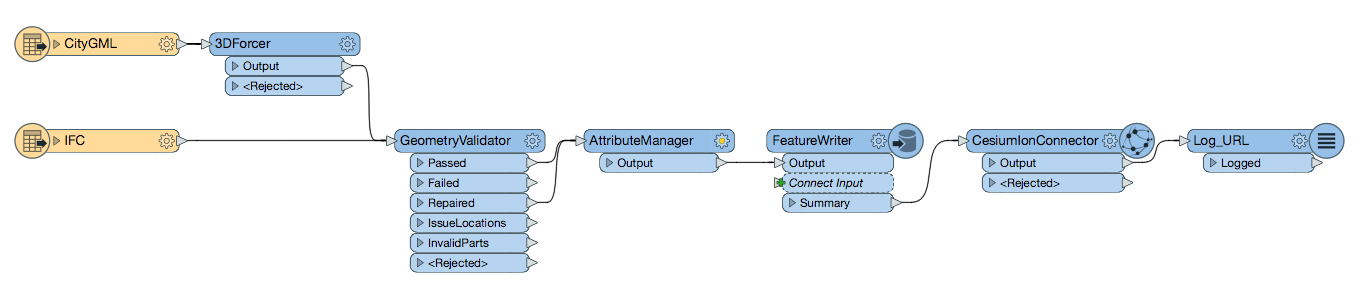
Example FME Workspace converting data to Cesium ion.
- Publish the data to the web. Some libraries, like I3S, need you to host the data in a specific place. Other libraries, like Leaflet, don’t care where the data is as long as it’s accessible (e.g. you can send it to your Amazon S3 bucket).
- Use the library to build a web page that references this data. This will likely involve coding JavaScript and/or HTML, or using the technology’s interface to build the page (e.g. as with Cesium). For some libraries, like three.js and Leaflet, FME can generate this code for you.
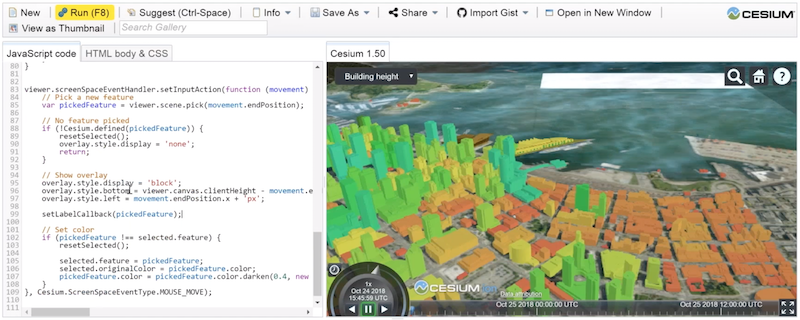
Preparing a 3D data visualization using JavaScript in the Cesium web interface.
- Host your final product on the web via FME Cloud. Keep the web visualization up to date by running your FME workspace on a schedule or in response to an event, e.g. whenever new source data arrives. (Find examples in the FME Server Playground.)
Helpful FME Tips
FME writes to many of the above formats and has a lot of transformers to prepare the data for whichever library you use. Start typing a keyword, like ‘Cesium’, on the FME Workbench canvas and you’ll see the right writers/transformers for your task. Beyond that, here’s everything I can think of to get you running with your web visualization.
- Data simplification: While some formats like glTF or Cesium take care of this, you’ll probably want to perform some of it yourself. Helpful transformers include the MeshSimplifier (to reduce the number of triangles), Dissolver (to dissolve boundaries), and Tiler (to break large data into pieces).
- Data quality: Here’s a checklist and a tutorial on using FME for data validation.
- Open data portals: Here’s an article with tips on building a web portal.
- Background maps and textures: For three.js and other libraries that require folders of images, use any of FME’s raster writers.
- Coordinate systems: Get the data into the right coordinate system using the Reprojector transformer (or CsmapReprojector or another *Reprojector transformer, if you want to use a different reprojection engine).
- Converting geometry to 3D: Helpful transformers include the 3DForcer, Extruder, FaceReplacer, AppearanceSetter, GeometryFilter, TINGenerator, SurfaceModeller, and Triangulator.
The above libraries offer impressive and convenient ways to share your geospatial data in a web browser. FME can convert and prepare your data for your library of choice, publish it to the web, and keep your visualization up to date via FME Server automations.
Watch our on-demand webinar to see live demos of these tools
This isn’t an exhaustive list, so let me know: what tools have I missed? Which one(s) do you plan to use and why? Leave a comment!

Tiana Warner
Tiana is a Senior Marketing Specialist at Safe Software. Her background in computer programming and creative hobbies led her to be one of the main producers of creative content for Safe Software. Tiana spends her free time writing fantasy novels, riding her horse, and exploring nature with her rescue pup, Joey.