With CesiumJS, you can create a web visualization to display your geospatial data in a browser—making it easy to share your data with anyone, anywhere. Here are the steps I took to prepare 2D building footprints for a 3D CesiumJS web visualization. Download the workspace and play with the output below.
Source Data: 900 MB of Polygons
It is always fun to play with an interesting dataset. A recent publication of 125 Million building footprints in the United States to the OpenStreetMap community is a perfect example of a dataset with which I would want to make something interesting. This is how I ended up with a 900 MB JSON file representing the buildings of Washington state.
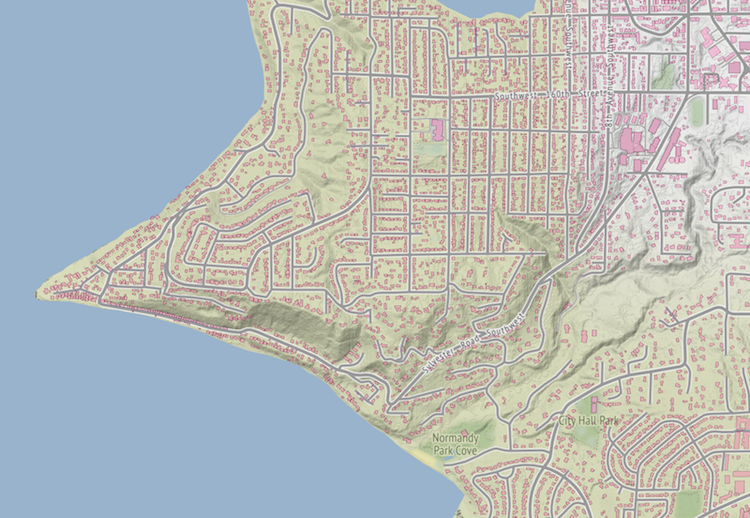
A quick inspection of the footprints revealed there was no elevation information. Perfect! This looks like a typical task for FME (and for myself) – bring in a few different datasets and combine them into something new and exciting.
Converting 2D to 3D with FME
Step 1: Combine Footprints with Elevation Data
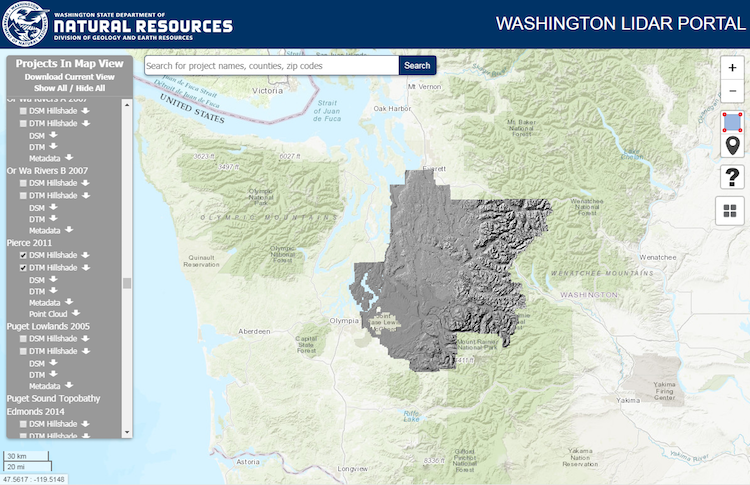
For elevation information, I went to the Washington Lidar Portal, a source of LiDAR and derived products managed by the Washington Department of Natural Resources. I picked two counties, Pierce and King, and downloaded the DSM and DTM for both—a pretty heavy 80 GB dataset with over one hundred pairs of raster tiles.
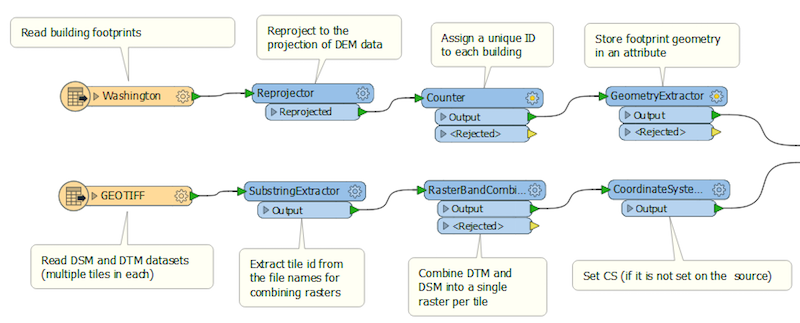
From here, FME can take care of everything. As my first steps, I brought the JSON footprints and rasters into the workspace, extracted building geometries with GeometryExtractor into an attribute, and using RasterBandCombiner, merged all DSM and DTM into two-band rasters, grouping them by tile names:
Step 2: Get Building Heights from Clipped Rasters
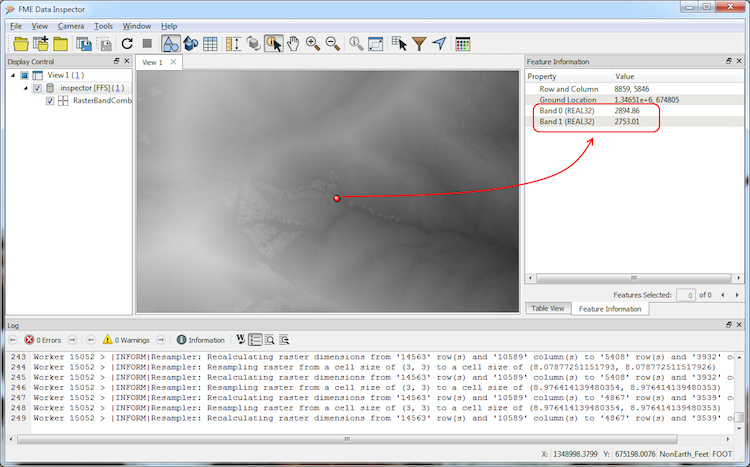
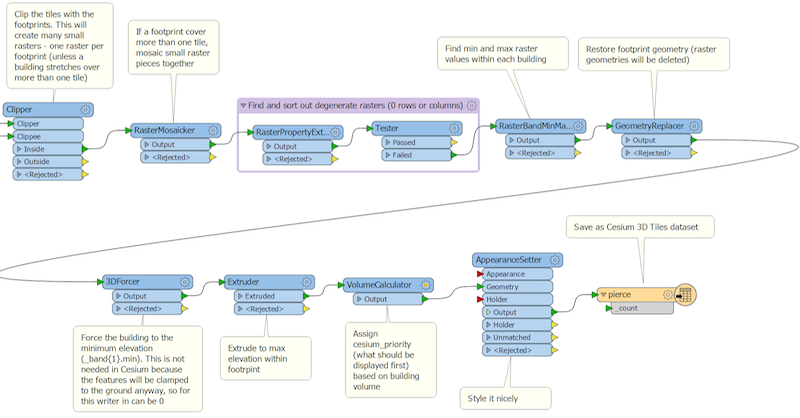
The buildings served as clippers to the two-band rasters (Clipper with “Merge Attributes” option checked so the building geometries will be transferred to rasters). The result is hundreds of thousands of small rasters – one raster per building (and sometimes more in cases when a building was stretching over the tile edges – I used RasterMosaicker to guarantee a single raster per footprint).
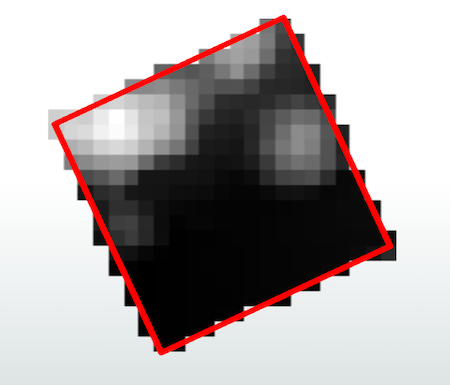
With RasterBandMinMaxExtractor, I extracted the minimum and maximum values per each band within each small raster – the lowest pixel value of the DTM band represents the ground, and the highest value of the DSM band, the top of the roof. To be precise, the highest value is not guaranteed to be the roof top – it might be a tall tree overhanging the building – but for our purpose of a massive visualization, it is an acceptable deficiency.
Note DTM and DSM are raster products derived from LiDAR. This means when DEM datasets are not available, it is possible to use LiDAR data instead – FME will clip the point clouds, and then, with PointCloudStatisticsCalculator, we can find min and max values within the buildings.
Step 3: Extrude Footprints Based on Retrieved Elevation Values
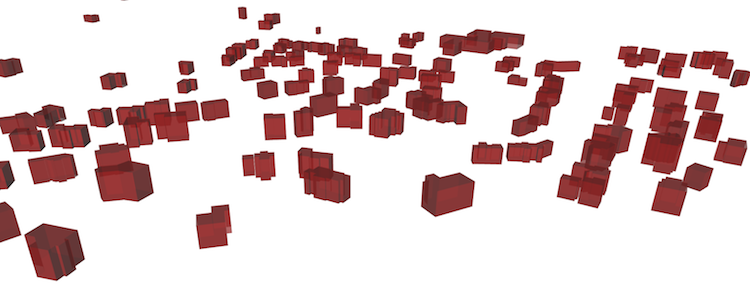
The final steps include replacing the raster geometry with the original footprint geometry, and extruding this geometry to the difference between max DSM and min DTM.
Sharing the Output in a Web Visualization
In the past, I have shared my output by publishing a few screenshots.
Today, I can easily share the full result with you thanks to modern web-based technologies. I hope you enjoyed my three.js experiments before, and now it is time to use the power of CesiumJS library, which is better suited for geospatial data and can handle huge datasets thanks to smart tiling and priority settings.
FME currently has two Cesium writers: one for point clouds (Cesium 3D Point Cloud), and one for 3D geometries such as solids and surfaces (Cesium 3D Tiles).
Writing to 3D Tiles is straightforward. The only format attribute we can set is cesium_priority, a real number that defines the relative placement of features within the tile hierarchy. I used VolumeCalculator to set this attribute. In Cesium, this leads to rendering bigger buildings before smaller ones.
The resulting dataset consists of a JSON file, which outlines the tile structure of the dataset, and a folder of 3D tiles with the .b3dm extension.
At this point, FME does not generate the HTML file necessary to open the scene in a browser; however, it can be done with AttributeCreator, where we can easily place the necessary code with minimal changes, such as specifying paths to the Cesium JavaScript library, CSS style sheet, and the dataset itself. Of course, it is possible to make any kinds of adjustments and add a lot more customization and functionality using JavaScript, but for that, I invite you to visit Cesium.org.
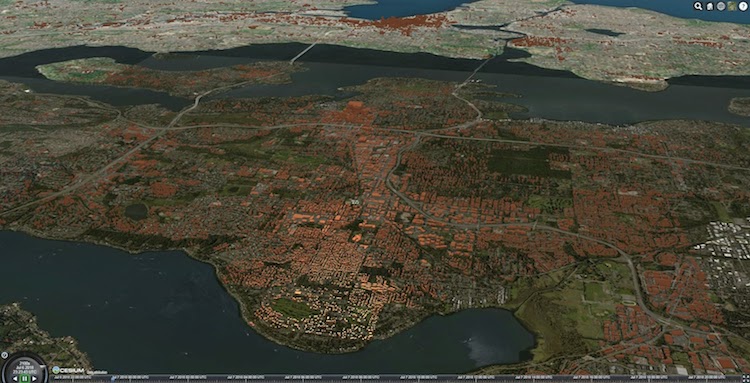
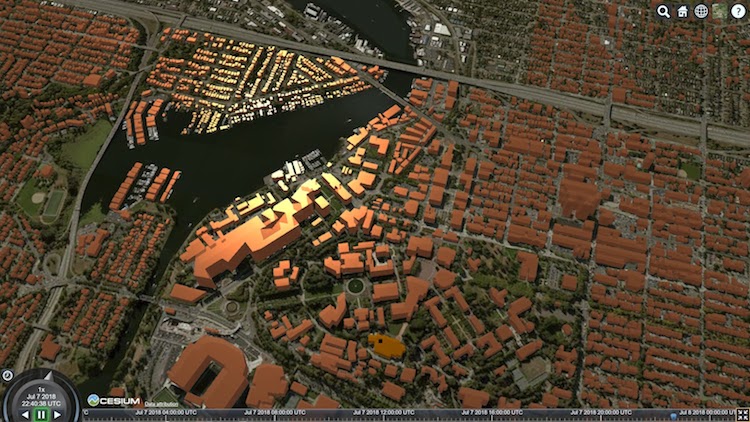
Meanwhile, you can have a look at 1.2 million buildings in King and Pierce counties of Washington state right in your web browser. A good internet connection and a powerful computer are recommended 🙂
Interact with the output in Cesium
But if you prefer the old way of sharing, here are a couple of screenshots.
Download and learn how the Cesium workspace is made and try it with your own data. We would love to hear how you use Cesium tiles in your work or if you don’t use them yet, where do you see them fit in your organization.

Dmitri Bagh
Dmitri is the scenario creation expert at Safe Software, which means he spends his days playing with FME and testing what amazing things it can do.