We all know business intelligence is important — but getting started with advanced analytics is daunting. That’s probably why everyone from the US Department of the Interior to The Texas Rangers has turned to Tableau for help. Yes, it’s possible to turn something as scary as “segmentation and cohort analysis” into a visual dashboard that a ten-year-old could understand.
The challenge is no longer “how can I present so much info in a meaningful way?”, but rather “how can I get all of my information into Tableau?” This is where data preparation comes in.
“Data preparation has become indispensable due to its overwhelming contribution to analyses and decision support.” – Lakshmi Randall, Gartner Blog Network
Safe Software’s partnership with Tableau means you can blend any data in any way you want and augment it with spatial information. Here are a few bonus tasks you can do in Tableau to create even better visualizations, with the help of FME as a data prep tool.
Merge data from even more systems
Tableau already lets you add data from a lot of sources — but what if you have data elsewhere that you want to incorporate into your viz? GIS, CAD drawings, databases, web/cloud data, raster imagery, even point clouds and 3D models? You can pull attributes, geometry, and properties from all of these to get exactly what you need from your viz.
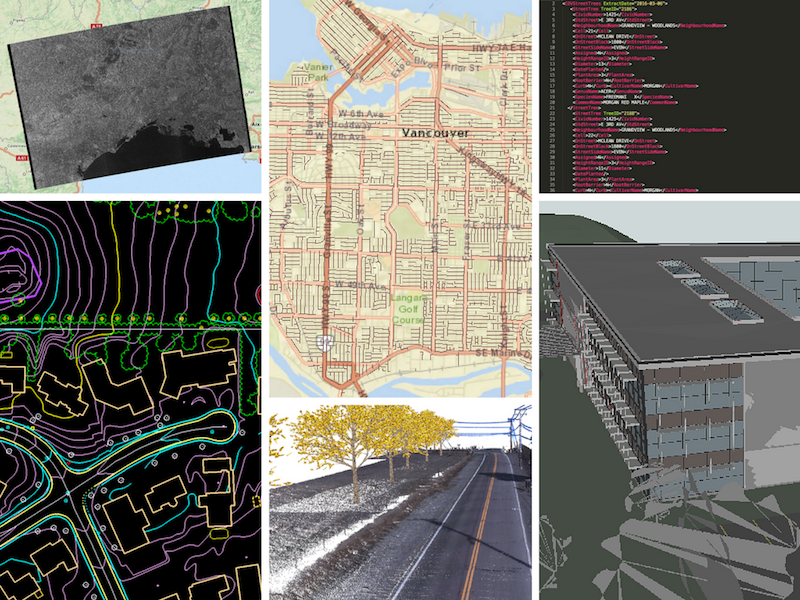
Examples of data sources you can integrate. Clockwise from top left: satellite imagery (rasters), GIS, XML, BIM, LiDAR point clouds, CAD.
- Try it: Get your GIS data into Tableau with our free online SHP to TDE converter
Integrate complex location info
Making a Tableau dashboard understandable and visual often means adding a spatial component. Maps speak 1000 words. Even data that isn’t inherently spatial can be enriched with location. You could join existing location information from another source, or use geocoding. Tableau supports simple geometry like points, lines, and polygons, plus web maps via WMS or Mapbox.
- See also: Enhancing Your Tableau Viz with Location
Clean data before adding it
Are all attributes present? Are any values missing or out of range? Do geometries self-intersect, have spikes caused by digitizing errors, or have other problems?
Quality control is an essential part of working with data. Before using and sharing it, and especially before performing analytics, you need to make sure all attributes and geometry are complete, correct, consistent, and compliant.
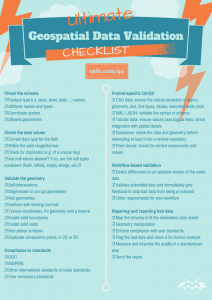
See also: Data Quality Checklist
Manipulate data before sending it to Tableau
Data doesn’t always come exactly how we need it. Some level of generalization, simplification, geometry transformation, attribute restructuring, or other transformations are often required before we can make use of the data. Some of the following tasks might be helpful before writing to a TDE:
- Reduce density by removing vertices from a shape
- Fit and smooth geometries using a specified tolerance
- Convert GIS building footprints into Tableau shapes
- Turn building centroids into lat/long
- Rasterize a vector floorplan
- Reproject the coordinate system to Web Mercator / WGS84
- Restructure the data model / schema so you display exactly what you want
- Many more. Check out the FME Transformer Gallery
Run data prep workflows automatically to keep the viz up to date
Using a dashboard for analytics when that dashboard is showing you yesterday’s data is useless. Manually running a workflow to keep the data up to date is way too inconvenient. You need to be able to keep the viz updated automatically.
All of the above data preparation workflows (and any complex integrations and transformations) can be run on a schedule or in response to a real-time trigger. This is FME Server’s specialty.
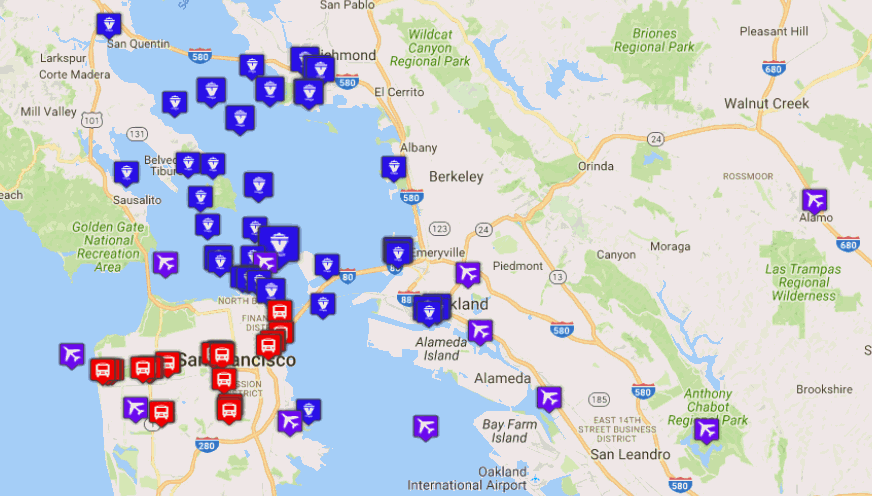
Monitoring data in real time (FME Server example: Live spatial dashboard)
Add spatial analysis
No complex analytics would be complete without spatial analytics! However complex your GIS, CAD, or other geospatial information, and whatever coordinate system it’s in, you can bring a meaningful representation of it into your viz alongside the rest of your data. For example:
- Show a heatmap based on location
- Proximity analysis, i.e. relationships between points
- Finding quickest / shortest / alternate routes
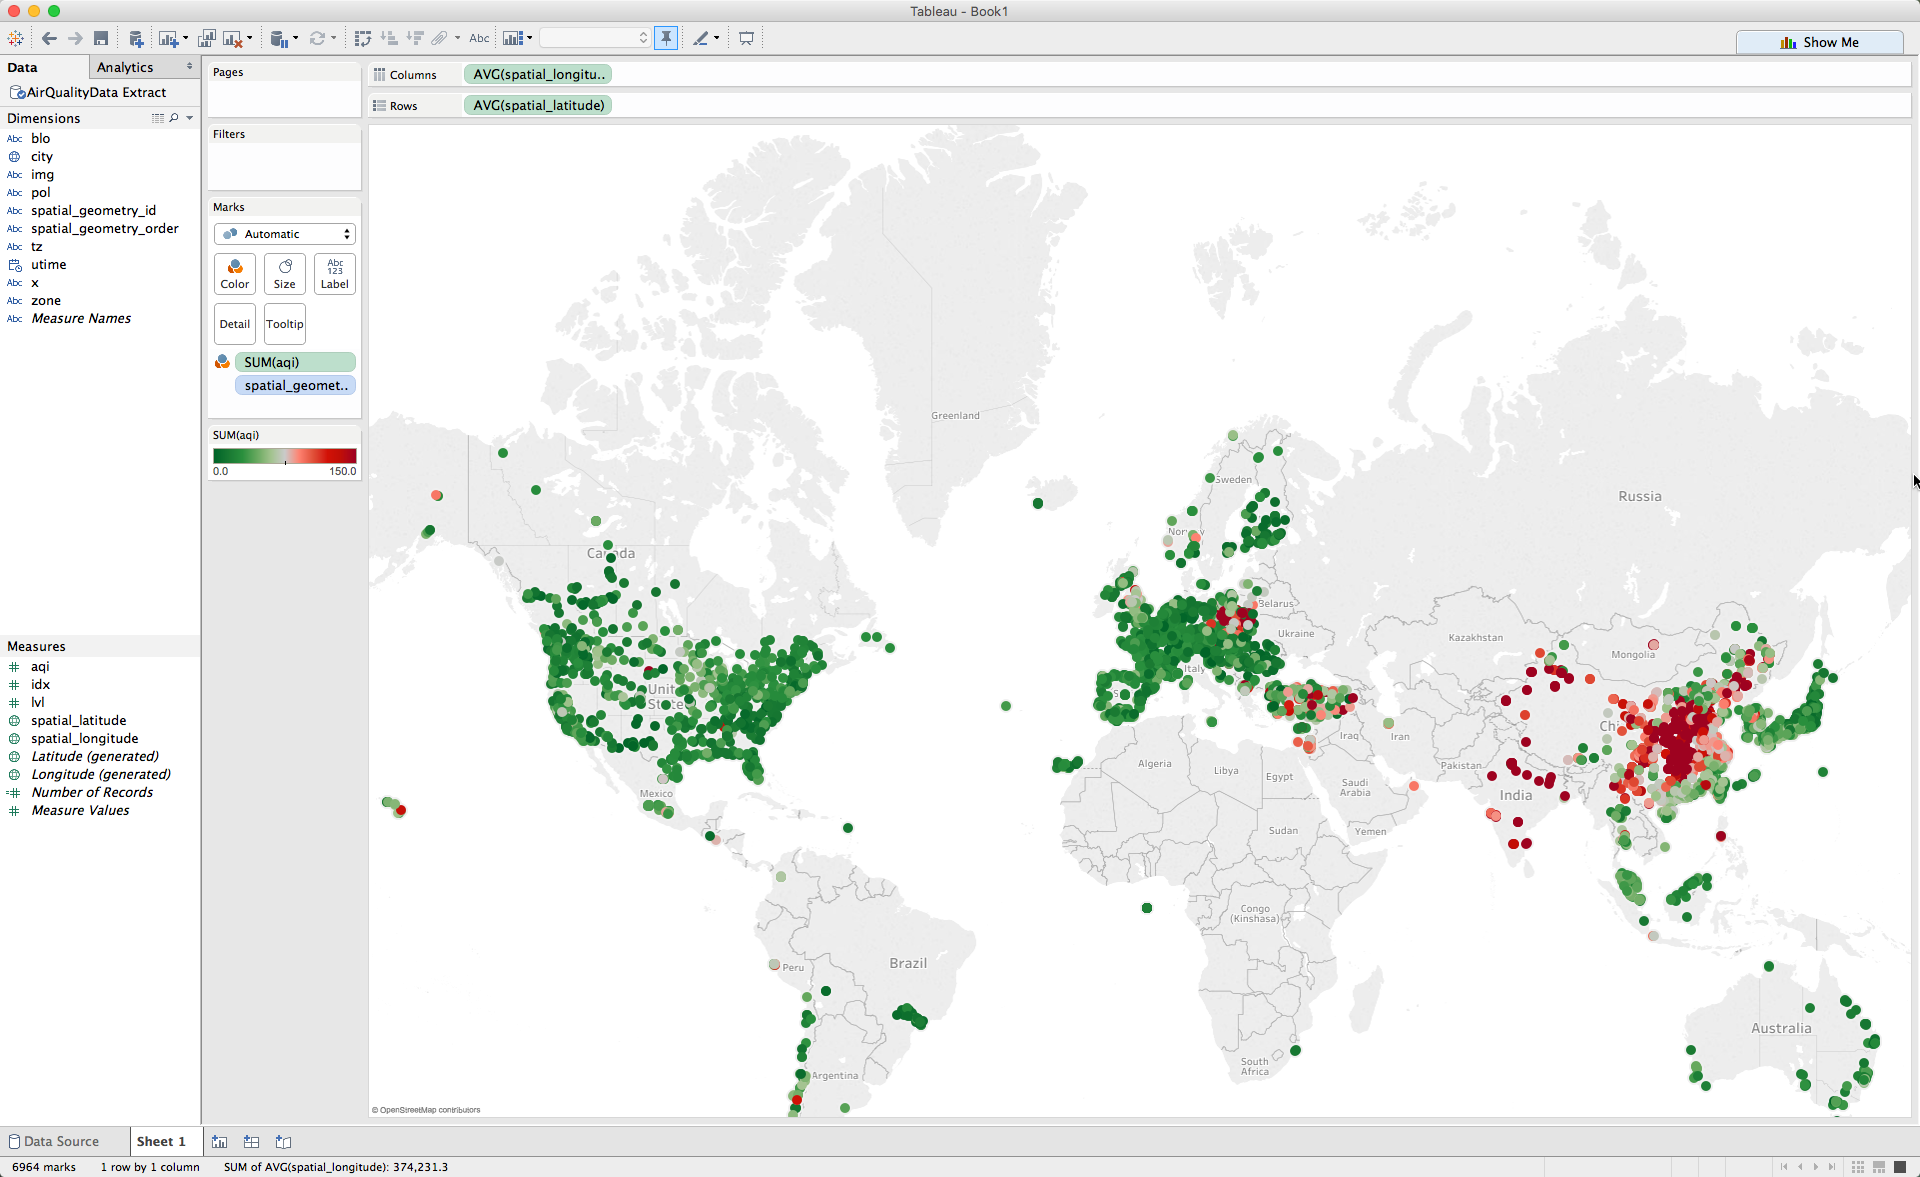
Color coding data points in Tableau based on an Air Quality Index calculation
*
A good Tableau visualization is one that strives to be as meaningful as possible. It should be highly visual, accurate, up to date, and insightful — not to mention simple. You can achieve this easily with a data preparation workflow like the following:
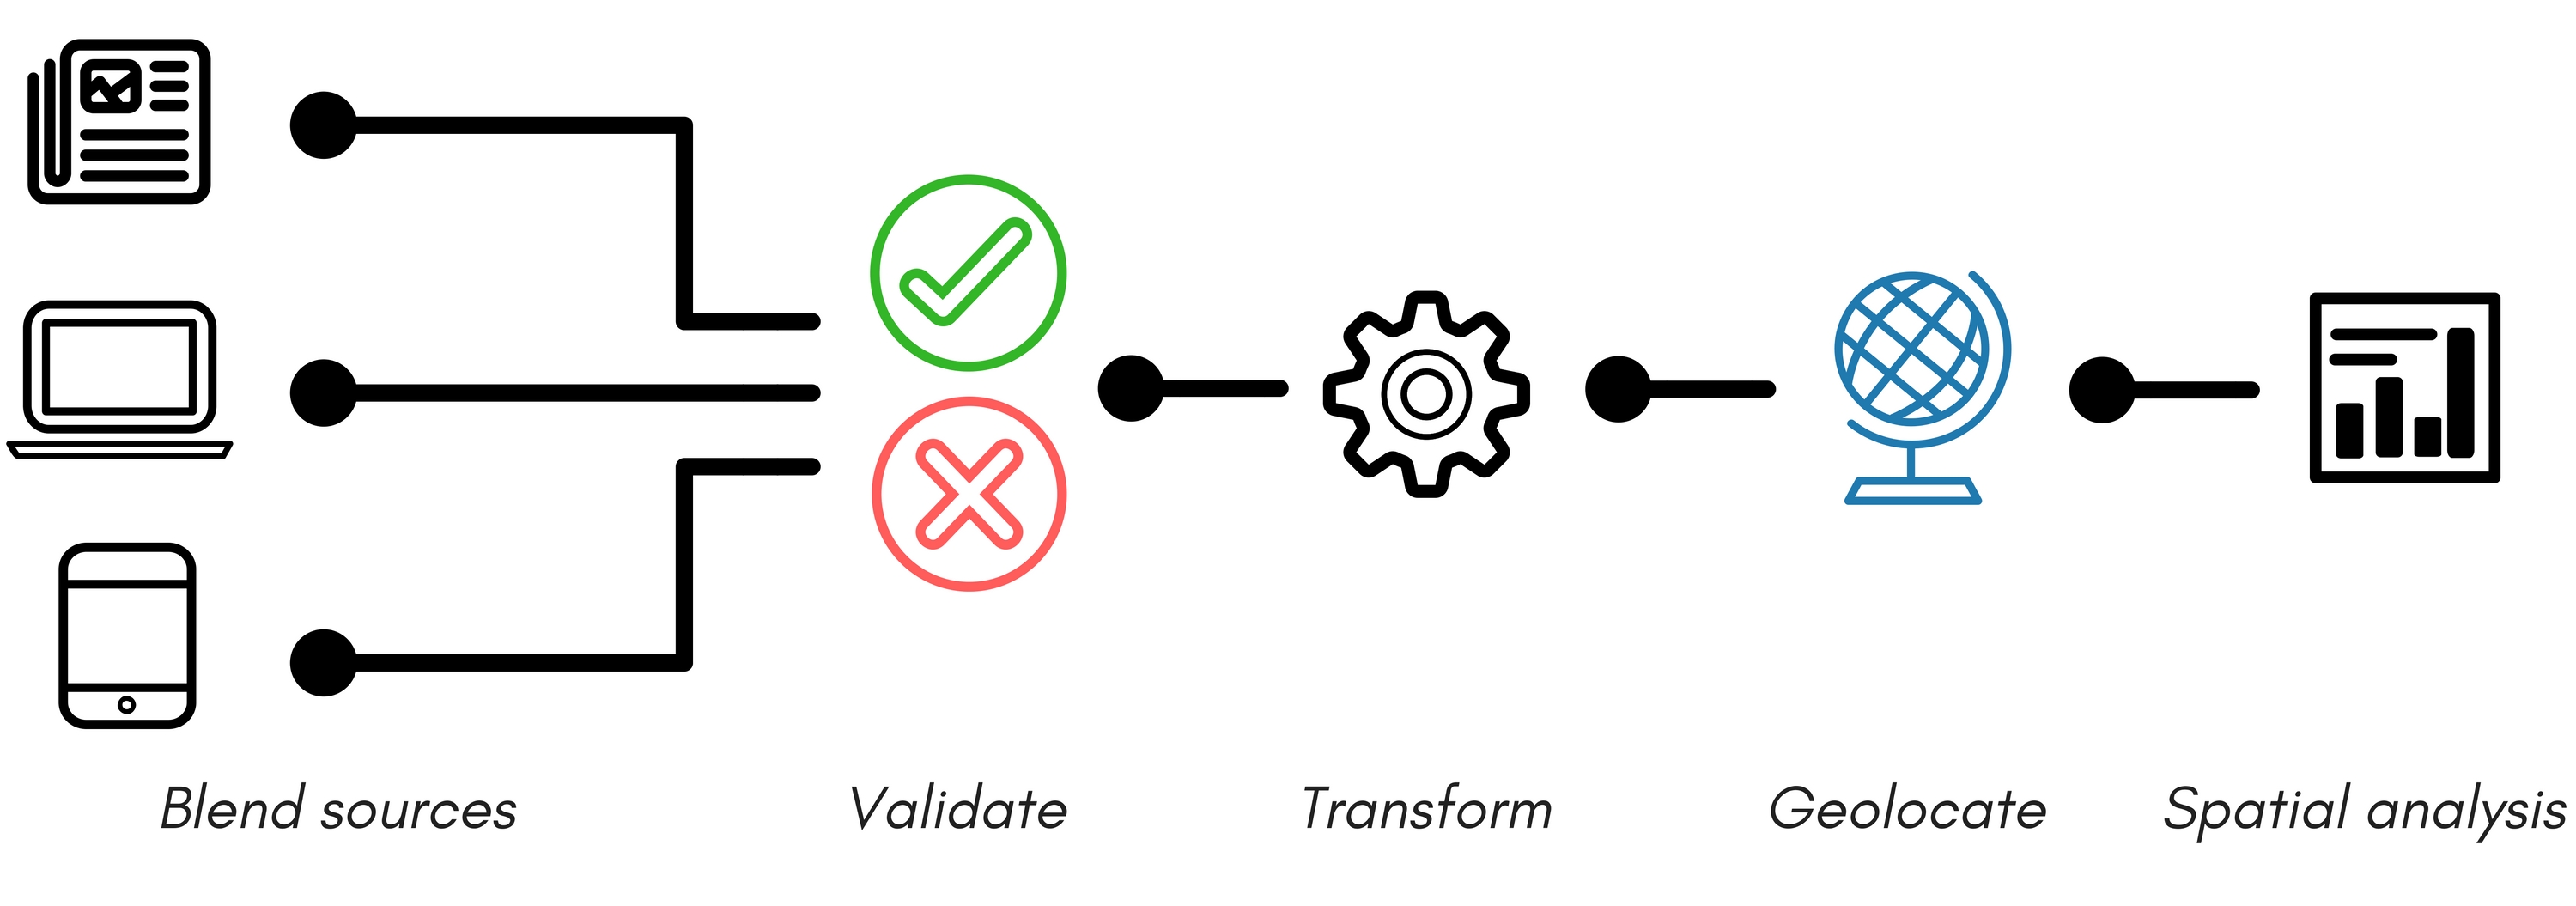
Then set the workflow to run automatically so your viz always stays current.
To learn more about data prep workflows, watch our Tableau webinar recording, where we go over real examples of companies that are using spatial data in Tableau.
- Try our free SHP to TDE converter
- Video Tutorial: How to Prepare Data for Tableau with FME – Processing Spreadsheets

Tiana Warner
Tiana is a Senior Marketing Specialist at Safe Software. Her background in computer programming and creative hobbies led her to be one of the main producers of creative content for Safe Software. Tiana spends her free time writing fantasy novels, riding her horse, and exploring nature with her rescue pup, Joey.