How to Convert to KML and Style it without losing your mind


Let’s be real for a second. If you’re trying to load data into an earth browser, the KML Reference is terrifying. Never mind the bigger stuff like tours and regions—even structuring and styling the data looks complicated.
Converting geographic data to this powerful format is straightforward if you use a data integration workflow. Let’s go through how a KML conversion workflow should look. At the bottom, we have a few additional resources and real examples.
Keyhole Markup what now?
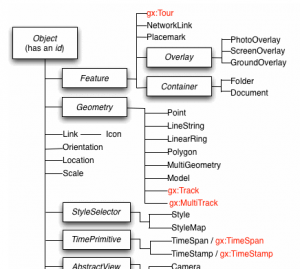
KML is an XML-based format used to represent geospatial information. It’s good for a variety of data—simple or complex, vector, raster, 2D, or 3D—anything from a simple Placemark of the location of the Golden Gate Bridge, to a real-time map of every bus, ship, and plane in San Francisco.

Because it’s XML-based, KML uses nested elements and attributes, making it an intelligent, flexible way to represent GIS information. I’m sure its XMLness means other good things too, but you’ll have to ask Don about that.
KML data can be stored in a single file or a directory of files. Various KML documents and images can be compressed into a KMZ archive.
Though best known for its use by Google Earth, KML is in fact an OGC format, which means it adheres to some pretty spiffing international standards.
Ok. Now let’s convert our data to KML.
You’re probably envisioning a really impressive scene for your data—a time-lapsed pattern analysis, or artistically styled points and polygons, or a real-time feed of every San Francisco segway tour.
By building a data integration workflow in FME, you can transform virtually any data, style it, and more. Here are the 6 components of a KML conversion workflow.
1. Read the source data
You might be coming from other GIS or XML-based data, CAD drawings, databases, tables/spreadsheets, a web format, or any number of other sources. Maybe you’re trying to combine more than one format, like Esri Shapefile and raster imagery. Whatever your source, it’s possible to convert it to KML. At this step, you need to extract the full schema, including geometry, attributes, and metadata.
2. Set the coordinate system
KML data is always in a lat-long projection. To be precise, it’s in LL-WGS84 (EPSG:4326). This might mean you’ll need to reproject your data to this system.
3. Structure the output
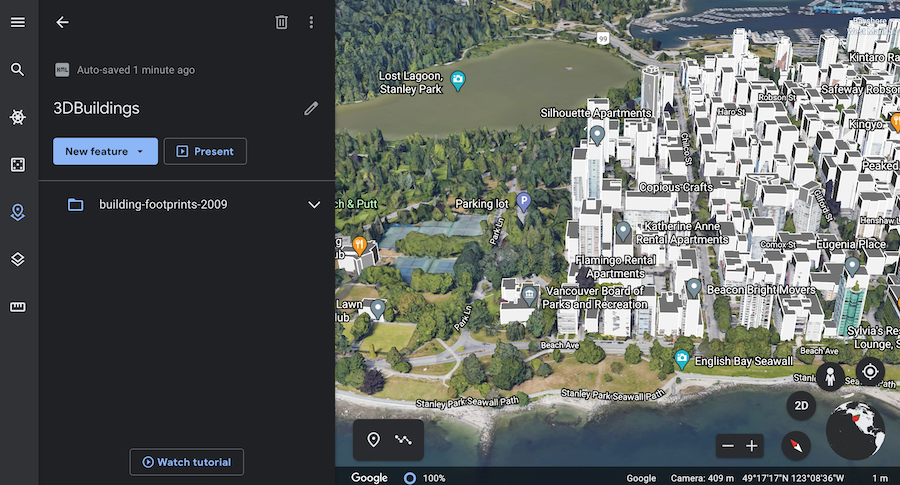
Now it’s time to define the KML properties. KML requires that each node has a unique ID. At this step, you’ll also define the geometry (e.g. points, lines, polygons), navigation tree (on the left), and the balloons that pop up when someone clicks a feature.
Define information like the geometry type, altitude information, and opacity. KML requires all features to be 3D, so if your data is in 2D you’ll need to set a Z value of zero to the features.
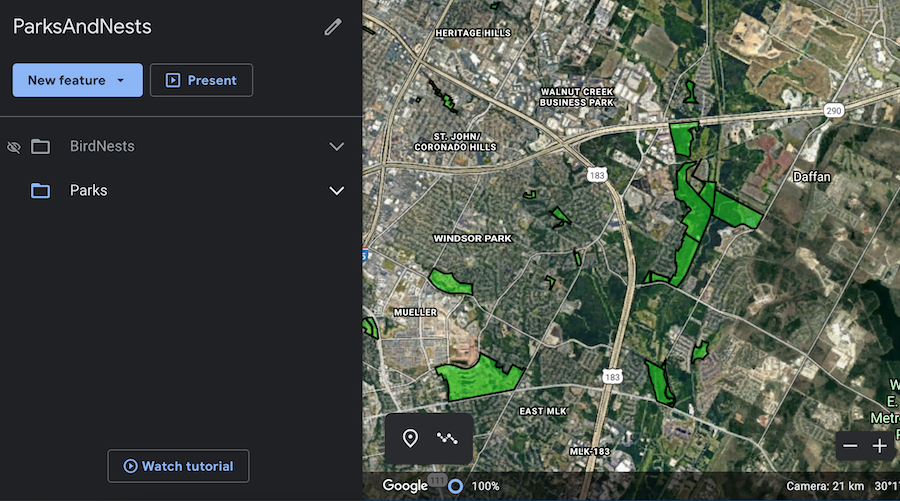
Set the name, description, and folder structure to be displayed in the navigation tree. Controlling folders is important to organizing output KML data—otherwise you’ll end up with all your information in one big list instead of as a nested hierarchy.
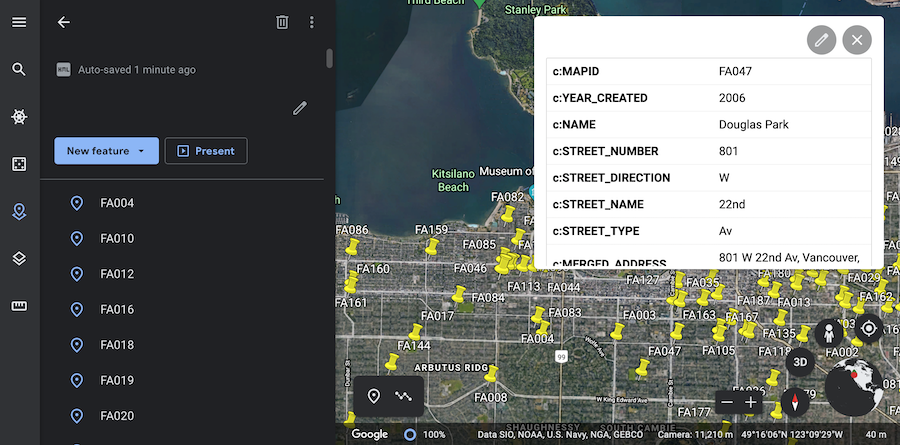
Balloons
These accept HTML as well as plain text, making them quite versatile. You can display a table of all the feature’s attributes, and an image or slideshow. You could even dynamically build a URL and embed a chart obtained from the Google Chart API.
4. Style the KML features
Now it’s time for basic styling. This involves setting color, opacity, icons, line width, line labels, and label styles.
Styles can be applied to all features, or you could supply a unique style for each. Unique styles create larger output files but allow for different settings, such as color, per feature.
5. Transform the data with more KML elements
This is where you can get more specific. Manipulate the data and set any number of KML attributes at this step.
- Create a time series by setting the time-related KML attributes. This means either setting a timestamp for the feature, or the start and end of a period of time.
- Control the camera perspective by setting the view-related KML attributes. Parameters involve the location and altitude, as well as more fine-tuned angle, rotation, and time-based information.
- Create a fly-through. Generate a KML tour from input features. Parameters include the name of the tour in the navigation tree, the total duration, type of transitions, stop/delay information, and view information.
- Visualize 3D data or force 2D data to 3D by adding a Z value and choosing to extrude the geometry.
- Link to live data feeds by setting up network links.
- Improve performance. Set the region-related KML attributes to control different levels of visibility depending on scale. This means calculating bounding boxes for the geometries, deciding what display sizes the bounding box must occupy in order to be visible, and deciding the extent to which the region fades upon zooming.
- Apply your own raster image in Google Earth using ground overlays.
- Web map tiling, i.e. Super-Overlays in Google Earth. Create tile caches by resampling rasters to various resolutions and splitting them into tiles. This is another good performance tweak for particularly huge datasets, as you’ll avoid overloading Google Earth.
6. Write the output
Now that you’ve formed all your attributes and geometry, write this information to your output KML dataset. Make it a .kml extension if you have one file, and .kmz if you need to zip up a few files and rasters. You can now open the data in your earth browser application of choice.
Automate the Workflow
To set up your own repeatable data integration workflow in FME, follow our step-by-step KML tutorial. FME inherently handles the geometry, metadata, and coordinate system conversions, and additional styling can be done in a graphical interface using KML transformers.
In addition, you can run the workflow automatically in response to an event, like on a schedule or whenever new data arrives in a folder. Check out FME Server to learn more about automating your workflows.
For example, Pelmorex Corp. created the Pelmorex Lightning Detection Network (PLDN) using FME, which automatically retrieves lightning strike data from sensors and restructures it into a styled KML file. The KML file is made accessible via Google Earth and other applications, enabling decision-making. A lot of organizations use data integration workflows to convert data to KML because it makes it more accessible—anyone can open a KML file in Google Earth and inspect it in a rich, visual environment.
Learn More: Additional KML resources
Explore more blog content headline

Data-Driven Marine Operations: 5 Ways to Generate Actionable Insights from Ship to Shore
Introducing FME Form 24.0: Redesigned User Experience for Focus and Consistency


[New!] AI Assist in FME: How to Build Better Data Integration Workflows with the Help of AI