Hi FME’ers,
This article is part technical, part evangelizing, and part just plain fun (well it was for me).
In it we’ll note FME as a spatial data development tool, discover alternative methods to programming loops, use FME lists to process some very ugly CSV data, apply Ordnance Survey open data to calculate which football (soccer) team’s supporters have the longest journey to follow their team, and then “borrow” a recent user technique for visualizing that information!
NB: If you’re just looking for the football numbers, they’re at the bottom of the article!
![]()
FME as a Development Tool
One way of looking at FME Workbench is as a quasi programming-tool. In fact I think that’s why software developers are some of the best users of FME (also some of the worst, but that’s another topic) – just like programming you create a series of commands that are executed in a particular order. Developers might even see FME Workbench as a form of Integrated Development Environment (IDE).
Regardless of that, it’s not necessary to know any programming languages to use FME, I just think that having the mindset of a developer suits perfectly the type of logic behind it.
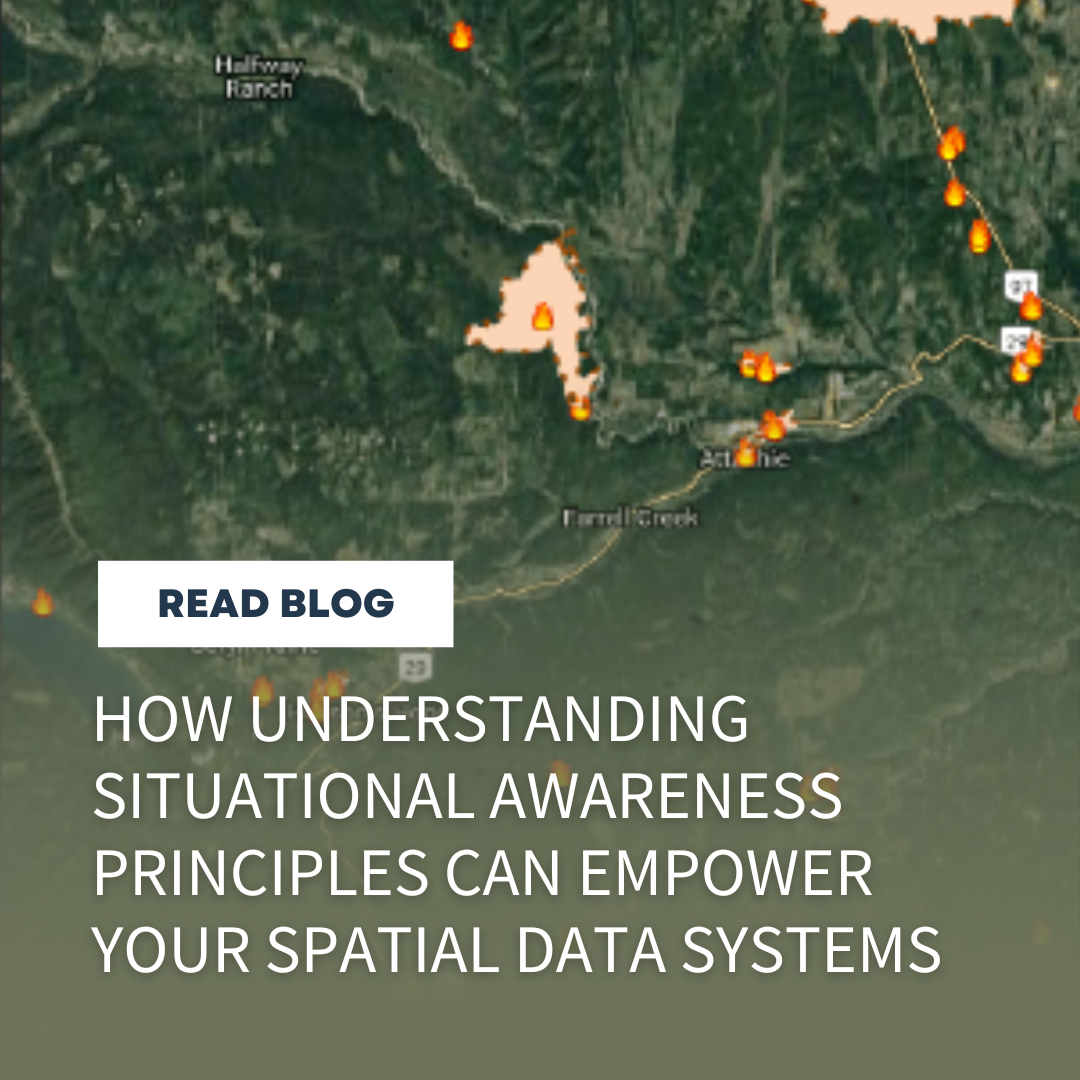
Of course, one key part of a programming language is the loop; the ability to repeat a set of steps multiple times, often until a condition is met. You can do this in FME by putting a loop object inside a custom transformer. For example here (click to enlarge)…

…you have a custom transformer that retrieves records from a list and processes them, incrementing the counter each loop in order to fetch the next list record for processing.
![]()
The Cloner-Loop Technique
As Mike Oberdries reminded me – when I asked for FME tips recently – there is another way to “loop” features in FME.
Mike’s task was to do this; create a set of concentric circle buffers around a central point:

Given what we know about loops, we could send the point feature through a loop, incrementing the buffer amount each iteration. However, Mike had another idea.
Instead of sending a single feature through a loop ten times (for example), why not create ten copies of that feature and process them once each? Then you don’t need to create a custom transformer or a loop. Plus you don’t have to worry about blocking transformers either, which are sometimes an issue.
Mike sent me a workspace, at the core of which is this:

Here the workspace is creating a series of concentric buffers around an origin point. The Cloner creates x copies of the origin point feature and gives each an ID (1,2,3,4,etc). That ID number is the key because it lets the Bufferer create a buffer of size [buffer size] x [ID number].
![]()
Cloner-Loop with a List
Coincidence or synchronicity I don’t know, but Mike’s email arrived just when I was answering a support question with a modified version of this technique.
It gets a bit complex, but basically the idea is to still use a Cloner to create multiple features, but also use a list to store all of the original information on each feature. I already had a good example of this on FMEpedia (Example 3 on this page) so I will use that to demonstrate. In that example I have a CSV dataset I wish to read, a simplified version of which looks like this:
Point,Lat,Long,NextPoint,PreviousPoint
75,163212,258589,33,32
33,163212,258579,34,75
35,163211,258565,36,34
34,163211,258581,35,33
36,163211,258553,37,35
37,163211,258554,38,36
39,163211,258567,1,38
32,163212,258588,75,A
1,163211,258577,Z,39
38,163211,258564,39,37
The horrific thing there is that the data points aren’t in order. Instead, each feature has a pointer to the next and previous features. It’s based on a support case so this is a real scenario!
What I could do to read this data is loop through that list of coordinates, again and again, each time searching for the “next” point and adding it to the end of the line. In fact I’d probably need two nested loops there; one to take each point in order and another to loop through the rest of the list to find it’s subsequent point.
However, instead I used the Cloner-Loop method. The difference (compared to the buffer above) is that each feature needs to reference other features. In this case I achieved this with a list, like so:

Basically this part creates a list of records. I’m sampling one single feature, and attaching all the other features to it as a list (using the FeatureMerger). There might be other – better – ways to create that list, but this works (although you can tell it’s an older workspace by the upper case transformer names).
Now here’s the Cloner. I count how many elements there are in that list and – instead of looping – I clone that number of features:
i.e. if there are ten items in the list I clone the data ten times, creating ten features that each have all of the other features stored in a list.
So what that has done is just create the right number of features, each of which has a list of all of the CSV records. They’re like strands of DNA! Each feature has encoded within it all of the “genetic” information to recreate the dataset, I just need to pull out the information in the right order.
So I don’t need a loop; there are transformers that will search (or loop) through a list for me. I just have to search within the list itself for the “next” record and extract that with the ListIndexer. I’m using FME variables in that workspace (hint: there is no VariableRetriever, I embedded the @GlobalVariable(GV) function into a ListSearcher) but now I could probably use the “Multiple Feature Attribute Support” capability that we added in FME2014.
IF that’s unclear, THEN preferably download the workspace OR (IF you have time) LOOP back to the start of this section and re-read UNTIL you understand the implications. It’s a great technique to be aware of, albeit a little complex.
 When Saturday Comes…
So, if the CSV reading was the practical part of this exercise, here’s the fun part. You can download the following workspace and data (as an FME template) from here.
I’d been thinking for a while about how to calculate which soccer team’s fans have the longest journeys to follow their team to away matches. I’m talking English Premier League here. Obviously I was going to use FME, but it looked like a loop (or two nested loops) would be required to complete this task. But then the Cloner/List method popped into my head, and so I went with that.
Here’s the core of the workspace:

What happens is that, for each club I create a list containing all of the other clubs. Then this time – instead of using a Cloner – I create the multiple features with a ListExploder. Now I have a feature for each journey between each club. The VertexCreator turns these into actual vectors, which look like so (click to enlarge):

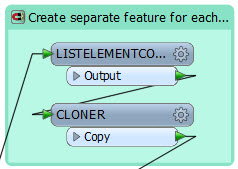
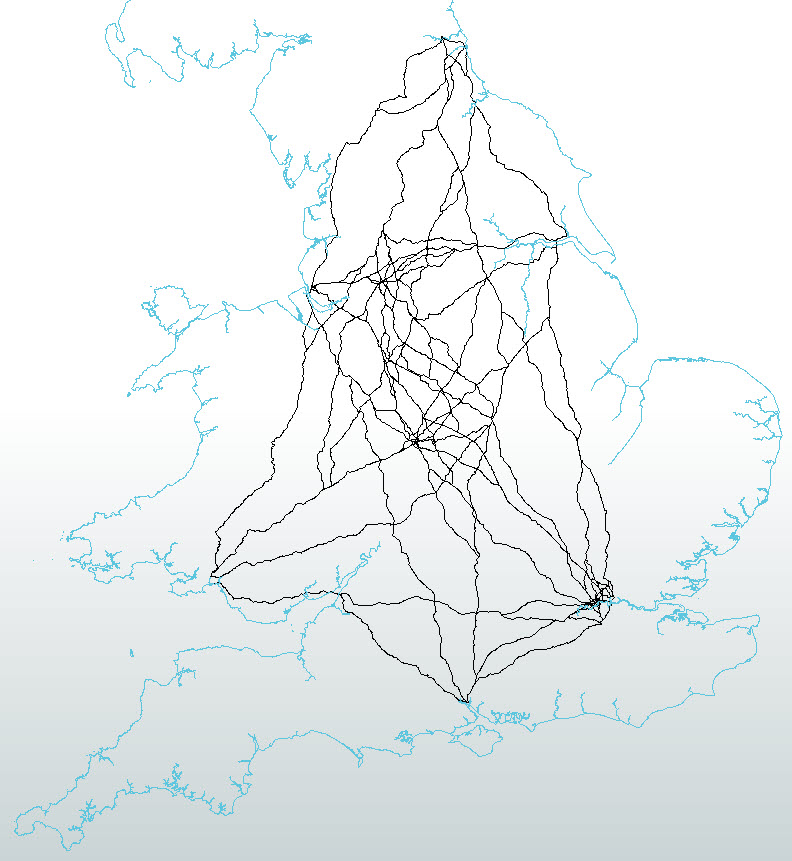
That gives me the straight line distance travelled. Of course, straight line distance isn’t too realistic; instead I should take the actual travel distance. I did this using Ordnance Survey open data processed with the ShortestPathFinder transformer:
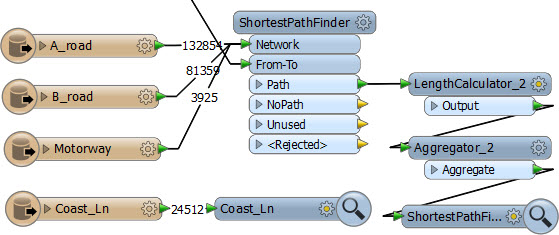
The Ordnance Survey road network for Great Britain looks like this
…which, when processed with the straight-line vertices, gives this set of shortest paths:
I can then add up the distances of all these journeys – grouping by football club – to show the cumulative distance required to follow each team.
NB: If you are interested in the results – I know many Brit FME’ers are also big soccer/football fans – then skip to the foot of the article where they are summarized as an appendix.
Of course, another option would be to send the start-end points to a web service that does route finding. That way you could apply live roadworks and traffic delays to the analysis. It would be simple enough using a HTTPFetcher, but perhaps a bit excessive for this particular example.
Mapnik and Visualization
Funnily enough, just as I was putting the finishing touches to the workspace, the results of our Mapnik design contest were announced. The winning entry looked like this (click to enlarge):
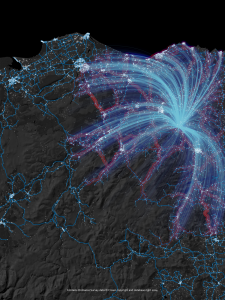
Not only does it show routes like I was creating, it also uses the same Ordnance Survey open data. More coincidences! It seems like this article was fated to be. But what’s obviously impressive about this map is the arc shapes representing a journey. Could I “borrow” that idea and do the same? You bet! Here are the trips a supporter of Aston Villa would need to take to follow their team to every away match:
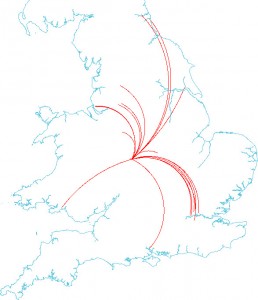
OK, you wouldn’t use that to navigate by, or analyze travel distances (they aren’t real great circles or anything) but it is an attractive way of visualizing the data! The creator of that winning map, by the way, is Owen Powell, who has since moved on to making exquisite-looking trees with the RandomNumberGenerator

When you’ve finished this article, go check out his blog!
Conclusion
I hope this is of interest. It should be: the Cloner-Loop technique, besides sounding like an episode of the Big Bang Theory, appears in enough of my projects to know it is important to be aware of. Basically, if you think you might need to use a loop, and things start to get a bit complicated, then this method may be simpler.
The only drawback is that creating multiple copies of data (with the Cloner) is going to have an obvious hit on performance – but in all my scenarios the amount of data is so slight as to render that problem insignificant.
The cumulative distance workspace, too, I think it very useful. OK, here I’m using it for a fun and trivial project, but you can apply it to many more scenarios (in fact, I might turn it into a custom transformer and put it into the FME Store). All you need is a source dataset of point features and – optionally – a road network. I was thinking about NHL teams’ travel requirements (though their fixture list is a bit more complex, and they go on “road trips” of several away fixtures at a time).
Anyway, why not give it a try? I’m sure you are already thinking about how you could use it! If you do, then please let me know. I’d be interested to see what uses you can put it to.
Regards
Mark

Appendix A: Data Results and Analysis
I didn’t want to stuff the article itself with soccer statistics that you might not have any interest in. But, in case you do, here they are. The results appear directly in the Data Inspector and, of course, it was just the work of a moment to add an Excel Writer to preserve the data in a more useful format.
So, who has the shortest and longest journeys? I thought the shortest must be a London club – since there is an obvious cluster with short distances between them – but it turns out to be a centrally located club, Aston Villa. They and their supporters have a season’s total of around 6,000km. Compare this to a Newcastle United fan who has a total travel distance of over 12,000km – yikes!
| Team | Stadium | Travel (KM) |
| Aston Villa | Villa Park | 6,281 |
| Leicester City | King Power Stadium | 6,312 |
| West Bromwich Albion | The Hawthorns | 6328 |
| Stoke City | Britannia Stadium | 6,499 |
| Manchester City | City of Manchester Stadium | 7,098 |
| Manchester United | Old Trafford | 7,111 |
| Arsenal | Emirates Stadium | 7,801 |
| Queens Park Rangers | Loftus Road | 7,817 |
| Liverpool | Anfield | 7,830 |
| Everton | Goodison Park | 7,840 |
| Tottenham Hotspur | White Hart Lane | 7,902 |
| Chelsea | Stamford Bridge | 7,919 |
| Burnley | Turf Moor | 7,992 |
| West Ham United | Boleyn Ground | 8,109 |
| Crystal Palace | Selhurst Park | 8,278 |
| Hull City | KC Stadium | 8,684 |
| Southampton | St Mary’s Stadium | 9,945 |
| Swansea City | Liberty Stadium | 11,350 |
| Sunderland | Stadium of Light | 11,927 |
| Newcastle United | St. James’ Park | 12,141 |
The above is road network distance, by the way, for return journeys. So (if my maths is correct) at an average fuel consumption of 10l/100km, and at a cost of £1.30 per litre, a Newcastle fan will be paying £1,578 per season in petrol/gas; that’s an average of £83 per away game (ouch – that’s probably more than the ticket costs!).
It’s also from stadium to stadium – I don’t want to speculate about whether a team’s supporters do actually live in the vicinity (or even the same part of the country)!
On the topic of road networks, the other interesting statistic is to compare the road network distance to the straight line distance. In this table the teams are sorted by rank, where 1 is the longest distance to travel:
| Team | Road Distance Rank | Straight Line Rank |
| Newcastle United | 1 | 1 |
| Sunderland | 2 | 2 |
| Swansea City | 3 | 3 |
| Southampton | 4 | 4 |
| Hull City | 5 | 5 |
| Crystal Palace | 6 | 6 |
| West Ham United | 7 | 7 |
| Burnley | 8 | 12 |
| Chelsea | 9 | 8 |
| Tottenham Hotspur | 10 | 9 |
| Everton | 11 | 13 |
| Liverpool | 12 | 14 |
| Queens Park Rangers | 13 | 11 |
| Arsenal | 14 | 10 |
| Manchester United | 15 | 15 |
| Manchester City | 16 | 16 |
| Stoke City | 17 | 17 |
| West Bromwich Albion | 18 | 18 |
| Leicester City | 19 | 19 |
| Aston Villa | 20 | 20 |
From this I infer that any team whose straight line rank is a higher number than the road distance rank suffers from a relatively bad road network. For example, Burnley have the 12th longest straight line distance (below average) but the 8th longest road distance (above average). Therefore I conclude the national road network serves Burnley relatively badly (i.e. it doesn’t closely follow straight lines). By comparison, Arsenal are relatively lucky (10th straight line distance, 14th in road distance) as are most other London clubs.
Incidentally, talking of long trips, one team stands out as being in an entirely different hemisphere. Do you know which? That’s right – it’s West Ham United; the only team to be located in the eastern hemisphere (i.e. with a positive degree of longitude).
Oh. And the longest single trip: Newcastle-Southampton (499 km each direction). The shortest? Everton-Liverpool (1.5km)
If you want to run this analysis for other leagues (the Championship for example) then please do, and let me know the results!
NB: This article and workspace contain Ordnance Survey data © Crown copyright and database right 2014. See here for the full OS OpenData license.

Mark Ireland
Mark, aka iMark, is the FME Evangelist (est. 2004) and has a passion for FME Training. He likes being able to help people understand and use technology in new and interesting ways. One of his other passions is football (aka. Soccer). He likes both technology and soccer so much that he wrote an article about the two together! Who would’ve thought? (Answer: iMark)