
Aviation Weather: MeteoSwiss Enhances SIGMET & AIRMET Alerts with Maps


MeteoSwiss enhances aviation weather alerts with maps, using FME to interpret text-based reports and FME Server to automate production and distribute PDF results.
 As anyone who has ridden out turbulence on an aircraft can attest to, weather is a big deal for aviation. Big planes, little planes, helicopters – they all have to operate within their limits and either deal with or avoid weather that can affect a flight, whether the effects be just an uncomfortable ride or serious danger.
Aviation is global – and so too is aviation weather forecasting and reporting. To ensure clear communications and safe operations across borders, the International Civil Aviation Organization (ICAO) produces standards that all member countries (which is most of the world) use for communicating information to pilots, airlines, air traffic control, and other stakeholders. In the case of weather, these guidelines designate how and when information is shared.
A Bit About Aviation Weather Reporting
To the uninitiated, the “how” of weather reporting looks like some obscure form of shorthand (if you’re a pilot, you’ll want to skip ahead to the next bit):
BOSR WS 050600 SIGMET ROMEO 2 VALID UNTIL 051000 ME NH VT FROM MLT TO YSJ TO CON TO MPV TO MLT OCNL SEV TURB BLW 080 EXP DUE TO STG NWLY FLOW. CONDS CONTG BYD 1000Z.
Pilots, though, (and other aviation professionals) learn to interpret this code very early on in their training, and would know to look out for occasional severe turbulence, below 8,000 feet above sea level, within an area defined by four airports (MLT, YSJ, CON, and MPV) in the Maine – New Hampshire – Vermont area of the world, and that the conditions are expected to continue beyond 10:00 am UTC.
The “when” of it is also set out by ICAO. There are regular, predictably issued weather reports that are used for flight planning (that look a lot like the example above), and then there are SIGMETs and AIRMETs – which are special alerts issued when something significant occurs (like severe turbulence, or a rapidly forming storm, or volcanic ash) that needs immediate attention.
Consider an airliner on a ten-hour long-haul flight – a lot can change in ten hours, and these reports need to get to the pilots enroute for decision-making, particularly if a flight path change is called for.
Making It Better with Maps – and Automation
Over in Switzerland, Oliver Baer and his colleagues at MeteoSwiss are the ones responsible for producing and distributing this information. It seemed to Oliver that SIGMET and AIRMET reports, which are inherently spatial, would be greatly enhanced by adding a map view of the information – and that it should be something you could automate with FME Server. And so he turned to Certified FME Professional David Reksten of INSER in Lausanne to make it happen.
David developed a workflow that has three primary tasks – parse and interpret the report text, build the geometry, and create PDF output. FME Server automates it, running the tasks every five minutes and so producing new reports within minutes of new weather data being released.
Interpreting Text Reports
There are a few different kinds of details that need to be extracted from the report, and it’s ICAO’s standard coding that makes this possible. Location descriptions are parsed out to be used for geometry creation, and the workspace also checks which administrative boundary zones (FIR/UIR) will be needed to clip the locations.
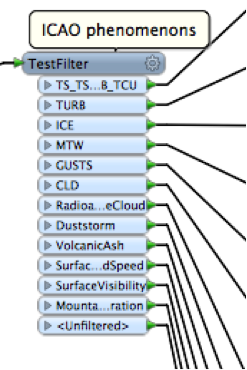
Some feature preparation is done for eventual symbolization, including interpreting the phenomenon type.
Creating Geometry
In the example SIGMET report shown earlier, a polygon would need to be created by knowing the locations of each airport in the report. A number of countries, including Switzerland, are moving to using geographic coordinates instead – which makes geometry creation a bit clearer.
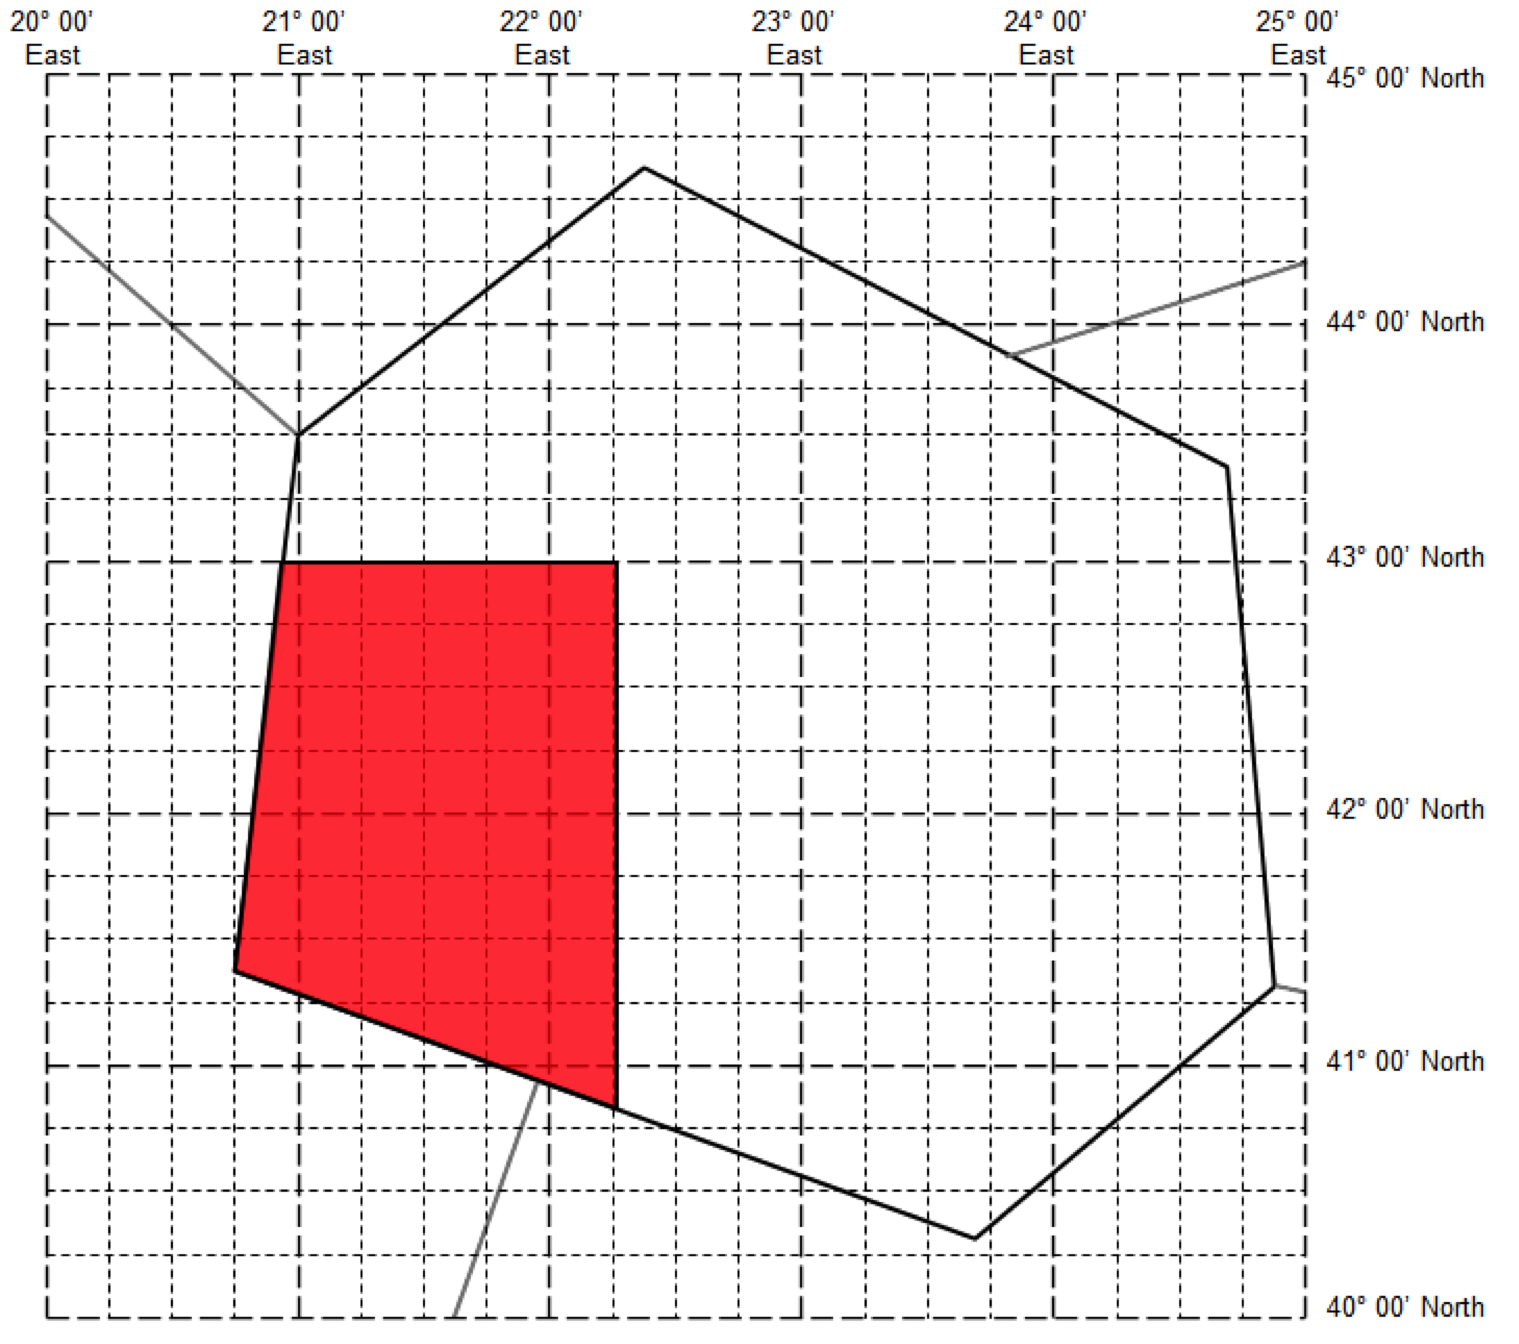
YUDD SIGMET 2 VALID 101200/101600 YUSO - YUDD SHANLON FIR/UIR SEV TURB FCST S OF N4300 AND W OF E02215 FL250/370 STNR WKN=
The polygons may be described by a single line (north of 43°N, for example), or two lines, like this example (south of 43°N and west of 22°15’E). There could be a diagonal dividing line, or even a multi-point polygon description – all provided by coordinates. All of these areas are ultimately clipped to the administrative boundary.
PDF Output
The final step is to assemble all the components in a PDF for distribution. The output features route into a pre-designed .mxd that handles symbolization and layout, and with a touch of Python the final result PDFs are written out.
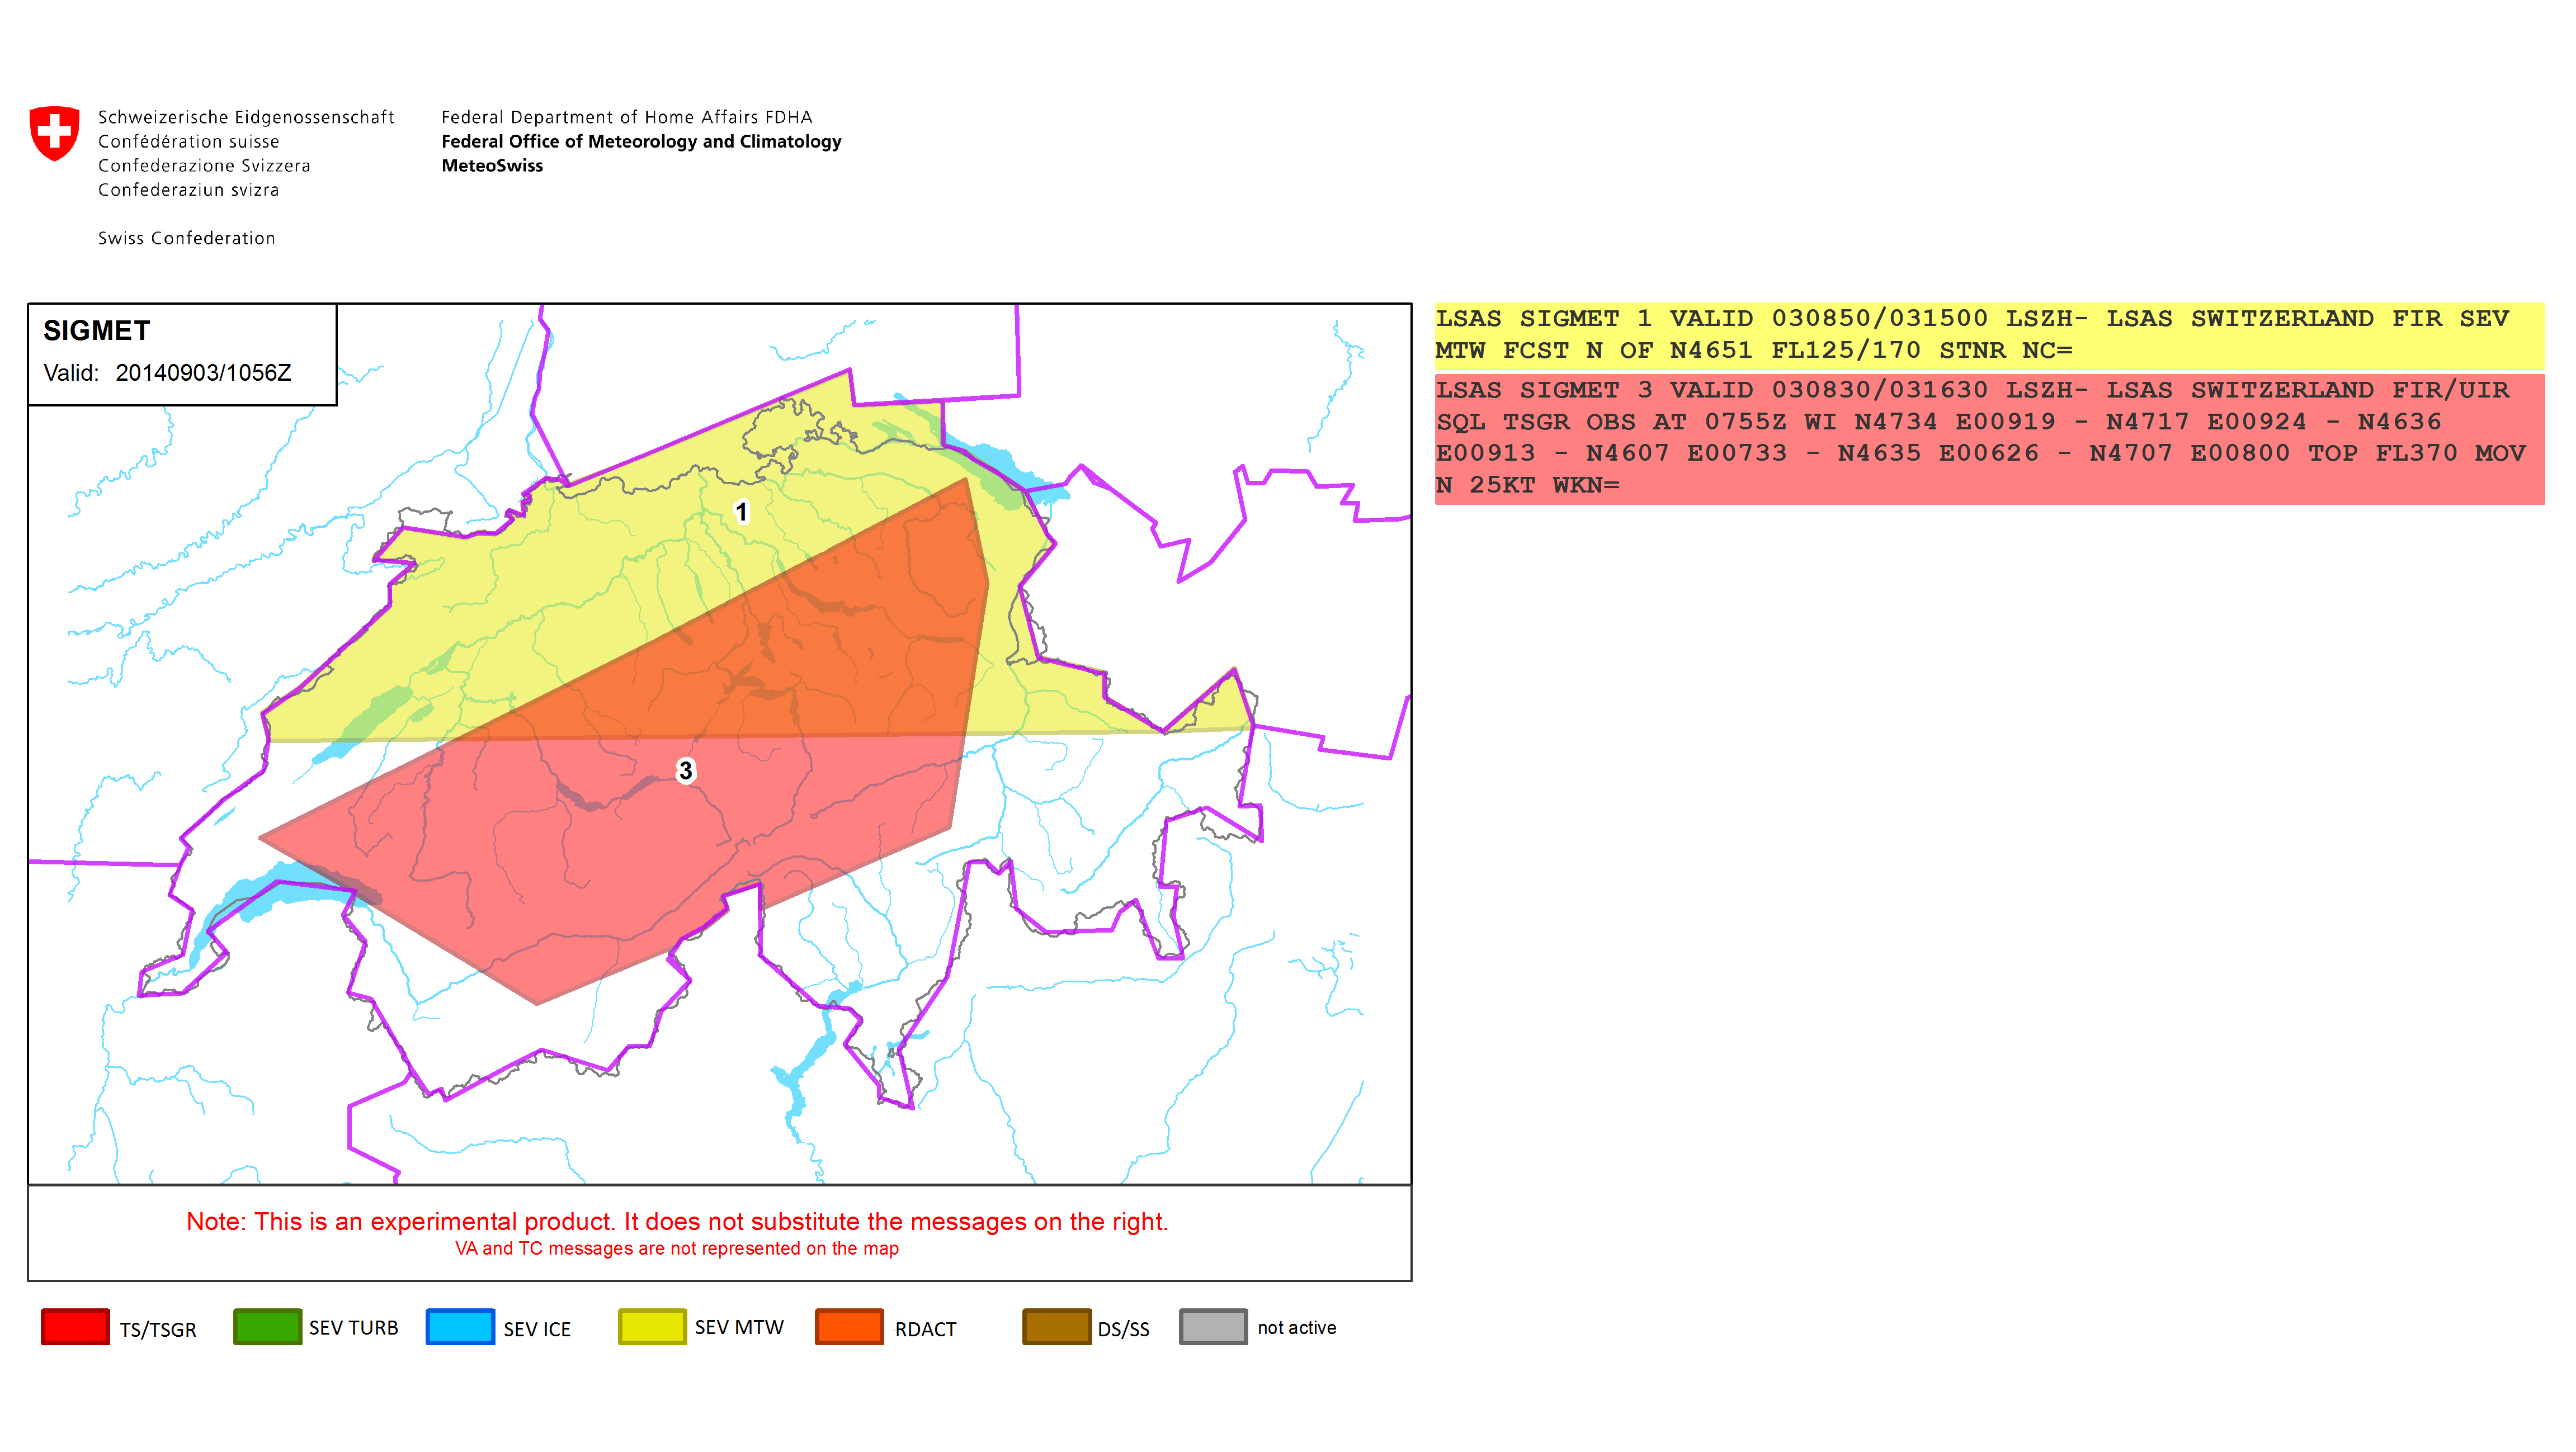
The finished PDFs are made available by MeteoSwiss to end users via an FME Server data streaming service, and make their way into the hands of airlines, flight planners, and pilots within minutes, now including the mapped interpretation of the report for clearer communications. And that means faster and better planning on the ground – and decision-making in the air.
The workflow is also easily extendable to other regions – any region that is using geographical coordinate descriptions, in fact. “FME is incredibly flexible,” says David. “It makes developing, deploying, and maintaining data integration processes a breeze.”
Great footage of a jumbo landing in high crosswind conditions. (Disclaimer: some experts believe this video may not be authentic.)
Learn more about the technicalities of PDF streaming on FMEpedia:
Using the data streaming service to stream PDF
More on Aviation –
From the 2014 FME UC: Runway & Taxiway Incursions (and FME Cloud)
KDOT Aviation: Keeping the Skyways Clear with FME (and Google Earth)
More on Weather –
From the 2014 FME UC: Real Time Lightning Alerts from The Weather Network
Explore more blog content headline

Data-Driven Marine Operations: 5 Ways to Generate Actionable Insights from Ship to Shore


Introducing FME Form 24.0: Redesigned User Experience for Focus and Consistency


[New!] AI Assist in FME: How to Build Better Data Integration Workflows with the Help of AI