
14 Ways to Take Charge of LiDAR Data


LiDAR technology has given the spatial data world some of the largest data volumes we’ve ever seen. Many point clouds I’ve worked with in FME have been tens of gigabytes in size. Coming from a place about a decade ago where I thought I’d never need more than five whole gigabytes of storage space . . . that’s a pretty impressive statistic.
Sizes continue to grow. In 2007, our users saw point clouds representing one point per square meter for airborne data. In 2013, we’re seeing more like eight points per square meter for the same data.
So how do you use this massive amount of data to your advantage? Below are 14 ways we’ve seen people make the most out of this exciting data type.
1. Translate between point cloud and other data formats
Much like CAD, GIS, rasters, and other data types, LiDAR data is not limited to a single format. Point cloud formats we’ve seen at Safe include:
- ASTM E57
- LAS (compressed or not)
- Oracle Spatial Point Cloud
- Bentley Pointools POD
- Point Cloud XYZ
- RIEGL Laser Scan Database
- Terrasolid TerraScan
- Z+F LaserControl ZFS
The most popular formats are LAS and XYZ – but like my mom used to tell me, “popularity gets you nowhere.” Ok, maybe that advice was meant for a pimply teenager, but my point is that modern data processing requires flexibility. You need to be able to work in a variety of formats, translating not only “point cloud to point cloud”, but also “point cloud to anything” and “anything to point cloud”.
Maybe you have an XYZ point cloud and you want a .lasd file so you can use it in ArcGIS. Or maybe, like in this example, you need to convert your LAS point cloud to E57. The ability to translate your point cloud data between formats is more important than ever.
2. Combine point clouds with other data formats
A magical chasm opens in spacetime when you combine LiDAR data with other data types. Whether that’s CAD, GIS, rasters, vector data, 3D geometries, another point cloud, a reconstructed pirate map, or all of the above, your point cloud data just got interesting.
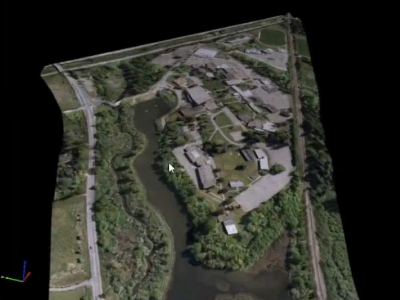
In this example, we’ve combined E57 point clouds with a DGN file of project boundaries and an ECW raster image. We applied colors from the raster and boundaries from the vector file, and generated a textured surface that you can easily send to your Great Aunt Myrtle in a 3D PDF. You could also add some 3D building geometries if you so desired. Goodbye, colorless and indistinguishable clump of dots.
3. Inspect LiDAR point components and values
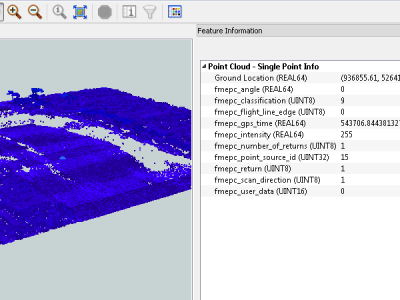
That multi-gigabyte beast on your hard drive has no hope of transforming into a handsome prince if you can’t decipher it. A key step in any transformation is inspection, so open your point clouds for viewing to find out what components are involved.
With the right inspection tool, even the most enormous point cloud datasets will start to make sense.
4. Change a point cloud’s coordinate system
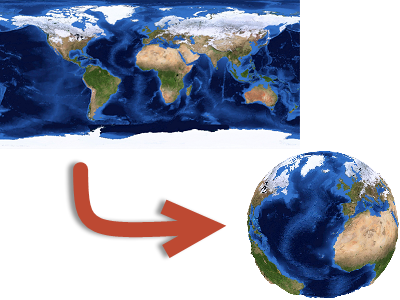
LiDAR data has come to us in a variety of coordinate systems (UTM, StatePlane, etc).
If you need to project the point cloud onto a map or combine it with other data, you can reproject it to another system just like any other type of spatial data.
5. Tile LiDAR data to speed up processing time
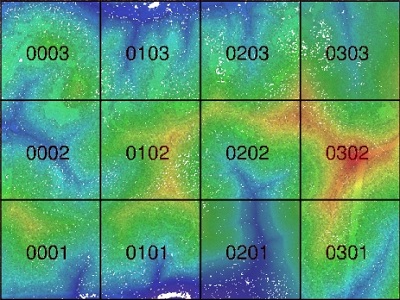
Tiling is when you chop the input features (points) into a series of tiles.
If you have a big point cloud and a lot of transformations to do, try tiling it and using parallel processing. It’ll make your old transformation time look like a sloth on sedatives. Of course, tiling is also useful if you need to generate smaller pieces of the point cloud for delivery.
6. Clip to a specific region in a point cloud
1.2 billion points isn’t a crazy number when dealing with LiDAR data. In fact, the word “billion” is pretty common. Chances are, you might not need all of those points in your output or analysis. Maybe you only want a specific region, like the area around a street.
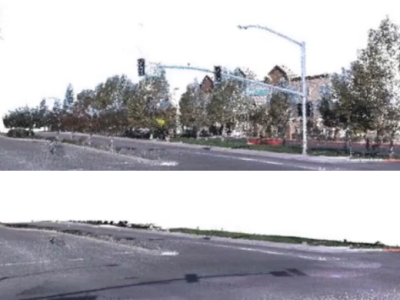
Clipping is when you toss away the points outside of a defined boundary. This can be mega-helpful in creating a manageable size to work with. If you provide a 3D solid as your clipper shape, you can also perform a cubic clip.
In this example, we’ve applied a cubic clip to clean out everything but the ground from a point cloud of a street.
7. Reduce the number of points in a LiDAR dataset
“That’s great and all,” I hear you saying, “but what if I do need the whole region?”
So maybe you want a manageable size to work with, but you don’t want to clip out important features and make the earth look like it got crushed by a giant steamroller. Thinning a point cloud reduces its overall volume; for example, by removing every Nth point.
Here we’ve drastically thinned the point cloud without losing the gist of the dataset, resulting in sped-up processing time.
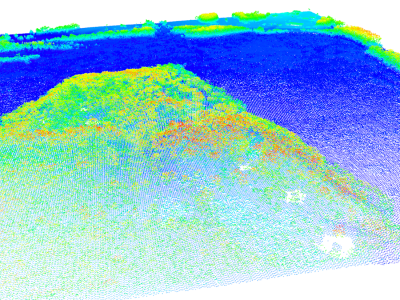
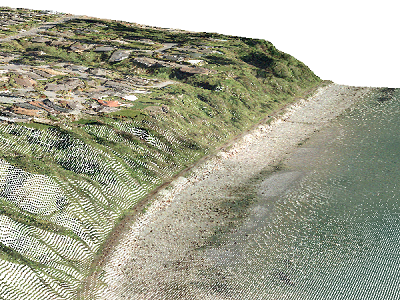
8. Create a surface model from a point cloud
If you’re interested in topography, you can make a 3D model out of your LiDAR dataset. Our stats show that a surface model transformation is one of the most popular point cloud tasks.
In draping this point cloud with RGB and DEM rasters, we were able to create a meaningful surface model and make sense of the original glob of points.
9. Split LiDAR data by component value
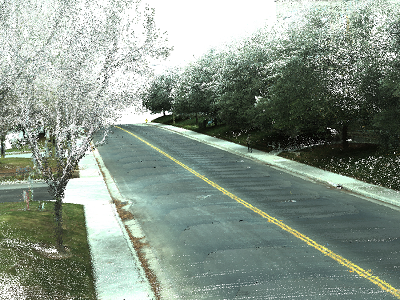
Splitting a point cloud means extracting points based on the value of a component. You can split by any component – classification, intensity, color, whatever.
In this point cloud, we can extract the yellow road markings by splitting the point cloud by color. The output will be a mini point cloud containing just the road lines, which we can turn into a vector feature.
10. Calculate and update point cloud extents
When I say calculating extents, I mean a metadata gathering of sorts. It can be helpful to inspect all the points and figure out the components that exist within your LiDAR dataset, then calculate the min and max value for each component so you know what kind of data you’re dealing with.
You can enforce the true extents on the data by checking the headers of the LiDAR file and comparing that information to the actual points.
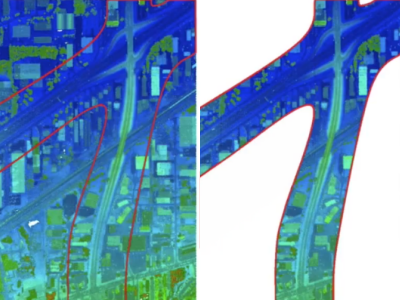
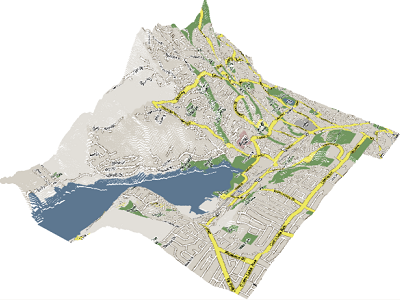
11. Divide LiDAR data along a line
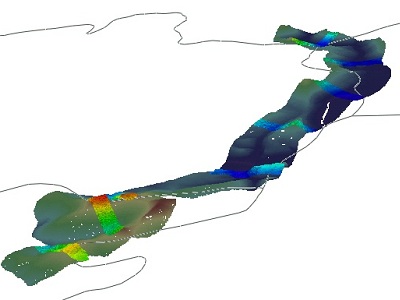
Given a line and a point cloud as input, you can generate point cloud slices (or profiles) along that line so you can use them for analysis.
Slicing and profiling is a great way to reduce the overall size of your LiDAR dataset and focus on what you need. In this example, we retrieved slices along a highway line and left the rest of the point cloud out, since the area around the highway is all we care about.
12. Set point cloud components manually
When writing a point cloud, you can manually set the components on your points – color being the most popular example. Just select the paintbrush tool in Microsoft Paint, paint over the first point, then choose another color and paint the second point, and keep doing that until you’ve hit all one billion … Kidding. Do it intelligently by overlaying the point cloud on a raster.
Of course, setting other components also leads to interesting results. For example, if you have a raster that has classes, you can transfer the classes over to your point cloud.
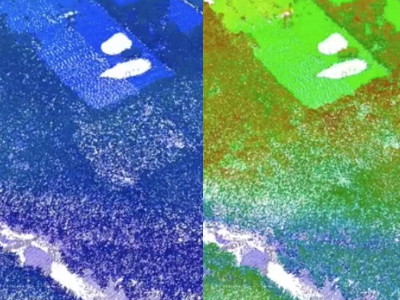
13. Apply point-by-point calculations to LiDAR data
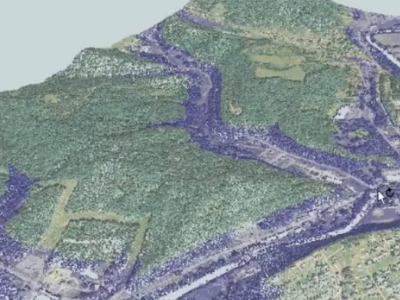
Expanding on the last point, the values you use to set the components manually don’t need to be taken from, say, a raster. You can also leverage attributes and parameters and set the component values based on a calculation.
This example uses calculations to give us a great visualization for flood level predictions. We set the color component so every point below a certain elevation is blue, and every point above takes on the color from the overlaid raster.
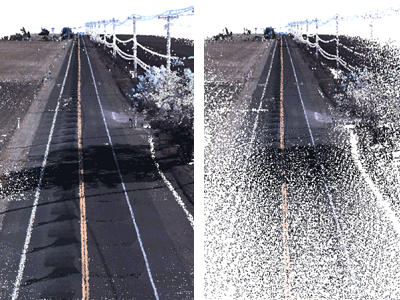
14. Filter LiDAR data point-by-point
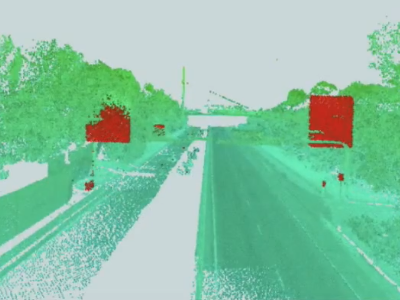
You can also use calculations to filter your point cloud. For example, we know that road signs are very reflective. (Unless you live in the woods or in one of those cities that doesn’t have any streets – in which case, this is me informing you that road signs are very reflective.) This reflectiveness would be represented in the intensity component of a LiDAR dataset. So if we create a filtering expression around the intensity component, we can extract the road signs.
You can see the road signs highlighted in red, having been extracted from the original point cloud behind it.
![]()
The potential for turning your point clouds into advanced and useful datasets is sure to keep growing, and there are certainly more than fourteen ways to work with this data already. What kinds of translations and transformations do you do with your LiDAR data? What do you find the most challenging?
Explore more blog content headline

Data-Driven Marine Operations: 5 Ways to Generate Actionable Insights from Ship to Shore
Introducing FME Form 24.0: Redesigned User Experience for Focus and Consistency


[New!] AI Assist in FME: How to Build Better Data Integration Workflows with the Help of AI